Download
1 / 22
240 likes | 546 Vues
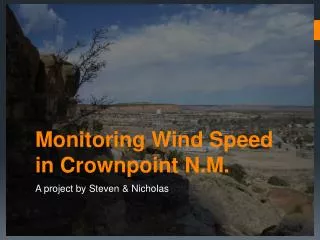
Dynamic Monitoring of Overhead Line Ratings in Wind Intensive Areas. Dr. Damian Flynn. Overhead Line Dynamic Ratings. Wind farms located in remote locations Upgrade transmission + distribution networks ? … network capacity lags wind farm expansion Equipment ratings are normally seasonal

E N D
Dynamic Monitoring of Overhead Line Ratings in Wind Intensive Areas Dr. Damian Flynn
Overhead Line Dynamic Ratings • Wind farms located in remote locations • Upgrade transmission + distribution networks ? • … network capacity lags wind farm expansion • Equipment ratings are normally seasonal • Overhead line cooling dependent on wind speed • Switch from static to dynamic equipment ratings ? • … delay requirement for network expansion
Factors Affecting Line Rating • Conductor material + dimensions • Wind speed and direction • Solar radiation • Ambient temperature • Humidity and precipitation • Average conductor temperature • Permissible conductor sag
Measurement Methods • Conductor sag • Conductor tension • Vibration modes • Meteorological / weather data
NIE TRANSMISSION NETWORK – PINCH POINTS >250MW of Wind N. Ireland Power System 275 kV double cct 275 kV single cct 110 kV double cct Coolkeeragh 110 kV single cct Moyle HV DC link Power station 275 kV substation Ballylumford to Letterkenny 110 kV substation Moyle I/C Power flow controller Mech switched capacitance Kilroot Omagh Dungannon to Swanlinbar Louth
Monitoring Methodology • Omagh - Dungannon 110 kV line (ACSR conductor) • A & B circuits at 10 locations • GPS time stamping of data • Daily GPRS burst to remote server Serial RS 232 GPRS Tnet Controller ISM Band Radio
Monitored Signals • Wind speed + direction • Solar radiation flux • Ambient temperature • Conductor temperature • Conductor current • 20 locations @ 5 minute intervals
Winter day Spring day Summer day Static Conductor Ratings 20 15 Ambient Temperature (C) 10 5 0 00:00 06:00 12:00 18:00 00:00 Time (hr)
Winter day Spring day Summer day Solar Radiation 1000 800 600 Solar Radiation (W/m2) 400 200 0 00:00 06:00 12:00 18:00 00:00 Time (hr)
Wind Speed Variability 20 15 Wind Speed (m/s) 10 5 0 0 5 10 15 20 25 Ambient Temperature (C)
Load Current Step - 550 A Ambient Temperature (C) Time (min.)
CIGRE Physical Model • Transient model – thermal mass cooling term • Engineering judgment required to select individual model parameters
PLS (Dynamic) Model Structure Conductor temperature = ao + a1 * ambient temperature (t) + a2 * exp(-b * average wind speed (t)c) + a3 * average wind speed (t) + a4, a5 * average wind speed (t, t-1)* sin(δ) + a6, a7, a8 * solar radiation (t, t-1, t-2) + a9, a10, a11 * conductor current (t, t-1, t-2) 2
16 Measured temperature CIGRE temperature 14 PLS temperature 12 10 Conductor Temperature (°C) 8 6 4 2 00:00 12:00 00:00 12:00 00:00 12:00 Time (hr) Temperature Prediction - November
16 Measured temperature CIGRE temperature 14 PLS temperature 12 10 Conductor Temperature (°C) 8 6 4 00:00 12:00 00:00 12:00 00:00 12:00 Time (hr) Temperature Prediction - March
Dynamic Conductor Rating • Estimate average conductor temperature Conductor length Conductor catenary sag • Estimate maximum current per monitored section Identify limiting line section
Conductor Rating Prediction PLS 1800 CIGRE 1600 Current (A) 1400 1200 1000 06:00 12:00 18:00 00:00 06:00 12:00 18:00 00:00 06:00 Time (hr)
2000 1800 1600 1400 Current (A) 1200 1000 800 600 06:00 12:00 18:00 00:00 06:00 12:00 18:00 00:00 06:00 Time (hr) Critical Span Determination
Outstanding Issues • Is the critical span being monitored? • define virtual poles, incl. wind speed up factors • Conductor temperature vs. mid-span sag? • Resolution and reliability of weather data • Limited (high current) PLS training data • Ratings for other in-circuit components? • Modified network protection settings • Likelihood of joint hotspots?
Future Plans • 10-20% line rating increase expected in most sheltered locations • High wind, low load, one circuit out of service • Re-conductoring and pole raising programme • Increase summer minimum rating • Extension to other circuits • Dynamic line rating, dependent on (1+ hr) weather forecast
Dynamic Monitoring of Overhead Line Ratings in Wind Intensive Areas Dr. Damian Flynn