Download

1 / 17
170 likes | 283 Vues
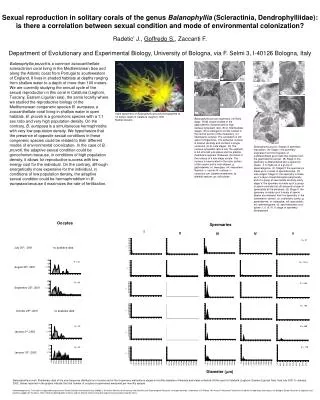
This document outlines Equilon Pipeline Company’s Risk Management Program, presented at the OPS Workshop on August 8, 2001. It provides a comprehensive background on risk management, including risk screening through a scorecard, data gathering processes, and risk assessment methodologies. Key elements include a demonstration project conducted on major systems, techniques for aligning data, and methods for assessing risk through systematic scoring and evaluation. The program emphasizes the importance of effective documentation and software solutions in ensuring safety and compliance in pipeline operations.

E N D
Equilon Pipeline Company, LLC. OPS Workshop August 8, 2001 Equilon Pipeline’s Risk Management Program
Equilon Pipeline Company, LLC. OPS Workshop August 8, 2001 • Background • Risk Screening Scorecard • Data Gathering • Risk Assessment Data Sheets • Risk Assessment Meeting • Documentation Software
Equilon Pipeline Company, LLC. OPS Workshop August 8, 2001 Background • Risk Management Demonstration Project • Conducted Risk Assessments on two major systems • Recognized the importance of aligning/integrating data • Viewing & digesting data was very onerous • There has to be a better way
PIPELINE RISK SCREENING - SCORECARD SCORING PROCESS Abbreviations: CAUSE INDEXESIMPACT INDEXES Outside Force Damage (OF) Population Density (POP) Corrosion (CR) Environment Sensitivity (ENV) Failed Linepipe/Weld (FP) Commodity Hazard (COM1/2) Operations (OP) Release Potential (DIA) Other (OT) Equation: Details: {OF%+CR%+FP%+OP%+OT%} X {[(POP)(COM1)+(ENV)(COM2)][DIA]} = SCORE The statements within each Cause Index are weighted relative to each other by “units” in parenthesis. Cause Indexes are weighted relative to each other by “%” in the upper right-hand corner. A pipeline system’s score for each statement is the product of the entry made (see STEPS) and the “units” shown. Statement scores within a Cause Index are added together, then multiplied by the Index’s weighting to get the Cause Index score. The System Probability score (%) is the sum of the five indexes. The statements within the Population Density and Environment Sensitivity Impact Indexes are weighted by “points” in parenthesis (POP-1 & ENV-1 - points/mile; ENV-2 - points/crossing). A pipeline system’s score for each statement is the product of the entry made (see STEPS) and the “points” shown. These statement scores are added together, then multiplied by factors relating to the Commodity Hazard and the Release Potential (diameter) of the pipeline, to obtain the System Consequence score (points). The System Relative Risk score (points) is the product of the System Probability score (%) and the System Consequence score (points). Probability Consequence Relative Risk 3 of 10
Internal Data Public Data External Data Equilon Pipeline Company, LLC. OPS Workshop August 8, 2001 Data Sources
Alignment Sheets Smart Pig Data CIS Internal Data Public Data CPDM External Data Equilon Pipeline Company, LLC. OPS Workshop August 8, 2001 Internal Data Hydraulic Studies
Internal Data Public Data Wetlands Data Nationwide Imagery Data External Data Nationwide DEM Data Nationwide Population Density Equilon Pipeline Company, LLC. OPS Workshop August 8, 2001 External Data
HCA Data: High Population Areas Other Population Areas Commercially Navigable Waterways (CNW) Drinking Water Areas Unusually Sensitive Ecological Areas (USAs) Internal Data Public Data External Data Equilon Pipeline Company, LLC. OPS Workshop August 8, 2001 Public Data
Data Risk dB Risk Application Equilon Pipeline Company, LLC. OPS Workshop August 8, 2001 Work Flow Processing Data Acquisition Risk Assessment Meeting Risk Assessment Data Sheet
A - Airport B - Business / Office Building C - Church D - Daycare F - Stadium H - Hospital I - Interstate / Highway M - Mall O - Other Public Building P - Park / Recreation Area R - Restaurant S - School T - Hotel / Apartment Y- Yard / Home Population Concerns (High-Occupancy Structures) Equilon Pipeline Company, LLC. Legend - Population Consequence • Data provided by Operations / Maintenance personnel either: 1. Prior to Risk Assessment meeting using “Preliminary” Risk Assessment Data Sheets (instructions provided separately). 2. At Risk Assessment Meeting 10
HPOP Non- Intersecting Non- Intersecting Non- Intersecting Intersecting Intersecting Intersecting OPS - HCA (High Consequence Area) OPOP > 10000 CNW 2501 - 10000 501 - 2500 101- 500 0 - 100 Equilon Pipeline Company, LLC. Legend - Population Consequence • Data maintained and provided by DOT/OPS and displayed by Geofields. Based on intersection with ¼ mile Impact Zone HPOP - High Population Area (Urbanized) OPOP - Other Population Area (Other Incorporated) CNW - Commercially Navigable Waterway Population Density (Per Square Mile from 1990 Census) Based on intersection with ¼ mile Impact Zone • Data maintained and provided by U.S. Census Bureau, displayed by Geofields. 11
Equilon Pipeline Company, LLC. Legend - Potential Release Impact > 10,000 7501 - 10,000 Note: Scale varies by system Drain Volume (Barrels) 5001 - 7500 2501 - 5000 • Drain volume / time obtained from Operations/Engineering using Equilon’s Spill Model, displayed by Geofields. 0 - 2500 5 Hour Graduated Scale (1 Hour Increments) Drain Time (Minutes) Drain Distance (Feet) Graduated Scale (1000 Foot Increments) • Drain distance obtained from Geofields Overland Spread Model using Spill Model output file, displayed by Geofields. 12
Equilon Pipeline Company, LLC. OPS Workshop August 8, 2001 Why this Approach? • Effective • Systematic • Conceptually Simple • Participative • Dovetails with Integrity Rule
Equilon Pipeline Company, LLC. OPS Workshop August 8, 2001 Integrity Rule • Baseline Assessment Plan • Data Integration/Information Analysis • Supports Integrity Assessment Work
Equilon Pipeline Company, LLC. OPS Workshop August 8, 2001 Questions?