Exploring Polynomial Functions: Degrees, Zeros, and Equations
Learn about polynomial functions, degrees, leading coefficients, zeros, and how to write equations with given roots. Understand complex and real roots, odd and even degrees, and how to model data using polynomial functions.

Exploring Polynomial Functions: Degrees, Zeros, and Equations
E N D
Presentation Transcript
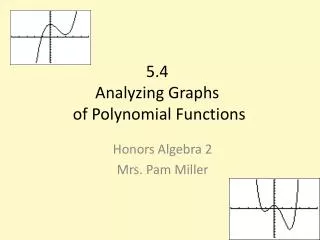
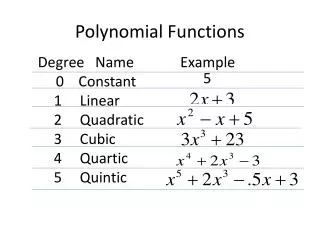
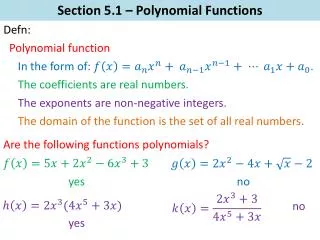
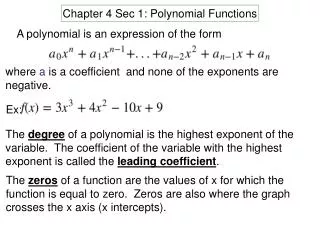
Chapter 4 Sec 1: Polynomial Functions A polynomial is an expression of the form where a is a coefficient and none of the exponents are negative. Ex: The degree of a polynomial is the highest exponent of the variable. The coefficient of the variable with the highest exponent is called the leading coefficient. The zeros of a function are the values of x for which the function is equal to zero. Zeros are also where the graph crosses the x axis (x intercepts).
Consider the polynomial function: • State the degree and leading coefficient of the polynomial. • Determine whether -2 is a zero if f(x). • Degree: 4. LCD: 3 • -2 is not a zero because when you plug it in for x and simplify, you get a number other than 0. An imaginary number contains i. A complex number is a combo of a real number and an imaginary number. Ex: 4+3i or 2-3i To write a polynomial equation when given the roots, rewrite the roots as factors and multiply them out.
Ex: Write a polynomial equation of least degree with roots 2, 3i, and -3i. To rewrite roots as factors, just subtract the root from x. Since the factors in this example are 2, 3i, and -3i, the factors would be (x-2), (x-3i), and (x-(-3i)). Multiply these factors out: (x-2)(x-3i)(x+3). Always multiply the two imaginary factors together first. (X-2)(x-3i)(x+3) Remember!! Middle terms cancel out This example has an odd degree of three (because there are 3 roots). It crosses the x axis only once because it only has one REAL root.
Examples: Write a polynomial equation with least degree with the following roots. Does the equation have an even or odd degree? How many times does the graph cross the x axis? • 3, 4i, and -4i • 5, -5i, 5i, i First step, now you finish it and do all of 2). Answers are on next slide. 1)
1) (X-(-4i)) becomes (x+4i) This function has an odd degree and crosses the x axis once.
What's different? Here we have an odd number of imaginary factors. We can't have that. There are ALWAYS an even amount of imaginary numbers. If we have i, we have to have -i so add the factor x+i. 2) This function has an odd degree and it crosses the axis only once.
Complex roots are all the roots of a function, real and imaginary. To find the complex roots, you can use a variety of methods. • Factor • Quadratic formula • Factor by grouping • Synthetic division • Long division **Most can be found in this section by factoring. State the number of complex roots of the equation. Then find the roots and graph the related function. Because this function has four terms, I know it has to be solved using factor by grouping. Factor out the (x-1) from both terms Set each factor equal to zero and solve. Solve on the next slide.
The. is 2i. You cannot have a square root in the denominator, so you have to rationalize the denominator. (Multiply the numerator and denominator by the denominator) Simplify!
State the number of complex roots of the equation. Then find the roots. The function has a degree of 2 so it has 2 complex roots. To find the roots, this function can easily be factored. Assignment: page 210 16,18,23-30, 32-47
Chapter 4 Sec 2: Quadratic Equations We can solve quadratic equations using factoring, quadratic formula, completing the square, or graphing. Only equations with real solutions can be solved by graphing. Ex: X=8, x=-2 X=-2 X=8 We get the same answers by factoring and by graphing.
Conjugates are pairs of complex imaginary numbers that have opposite signs. Ex: 4+3i and 4-3i Assignment: page 219 12-33 all Give quiz after this homework assignment.
Chapter 4 Sec 8: Modeling RealWorld Data with Polynomial Functions
STAT:EDIT • Enter domain in L1, range in L2 • Go to y=screen and make sure it's clear. Arrow up to PLOT1 and hit enter to turn it on. • Graph • STAT:CALC • Choose which function you think represents the data(refer to the chart on previous slide) • You will be given a general function using a, b, c, etc and the values for those coefficients • The r value lets you know how good a fit the line is to the data. For problems like the one on the following slide.
What the graph looks like: The data for a cubic line of best fit. I chose cubic because the graph looks the most like the cubic graph in the chart on a previous slide (or page 258 in your book). Now place the values given for a, b, c, d in for the equation given. The polynomial function that best models the data: Round the values for a, b, c, &d. Try #4-7 on page 262. Answers on next slide.
4. Quartic (compare it to the chart) 5. If you zoom out, it looks like a quartic. 2nd CALC, #7 The r value (.999976564) tells us it is a good fit. You can also put the above equation into the y= screen and see how it matches up with the scatter plot.
If you aren't sure what type of regression to use (linear, quadratic, cubic, or quartic) use what gives you the best r value. For example, the last problem we did was a quartic. If I was unsure, I would try a linear regression. When I calculate a linear regression, the r value is not good at all. The value of |r| should be as close to 1 as possible. The closer to 1, the better the fit. The r value for this linear regression is -.301.... So we know this isn't a good fit. 6) 7) in this one, I let 1950=0 so it is the starting point. Then 1960 is really 10, 1970 is 20, 1980 is 30, etc. That way we don't have x values close to 2000. The scatter plot looks linear so I will try that first. It gives an r value close to 1, so I'm good. A) B) 2010 is 60 years past 1950 so find what y is when x is 60. I looked in the table and see that when x=60, y=86.907 C)85=0.487x+57.68 X=56.0985 Plug 85 in for f(x) and solve. Round answer and the year will be 2006
Assignment: page 262 8-19 Give review after this homework is due: page 268 11-21, 54,55 Give test after this review is finished.