Australian communities infographic-2016-mccrindle
30 likes | 480 Vues
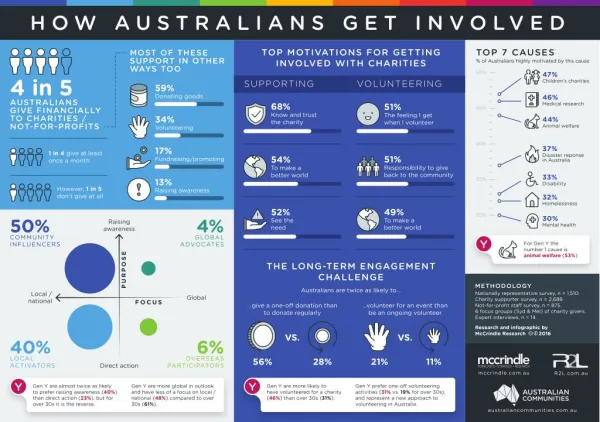
The results of our annual longitudinal study, which analyses the effectiveness, engagement and awareness of the Not for Profit sector, will be presented at the one-day Australian Communities Forum in Sydney on October 13.<br><br>The Australian Community Trends Report delivers a clear analysis of the social context in which the Not for Profit sector is operating, and shows that Australians are a generous bunch, with four in five Australian givers (80%) giving financially to charitable organisations.<br><br>Some of the findings which are presented in the infographic below from the 2016 research, will be shared by Mark McCrindle and John Rose (R2L & Associates) at the Australian Communities Forum.<br>MOTIVATION FOR GIVING<br>When it comes to motivation to give money to or volunteer with a charitable organisation, children and health are the top causes. Australian charitable givers are most likely to be highly motivated to give money to or volunteer for children’s charities (47%) followed by medical and cancer research organisations (46%) and animal welfare and wildlife support groups (44%). Compared to our 2015 research findings, children’s charities have overtaken health and disaster relief as the highest giving priorities in 2016.<br><br>THE KEY DECISION DRIVERS<br>The key decision drivers for Australian charitable givers are knowledge and trust of the organisation, which is the most significant influence on Australian givers getting involved with a charitable organisation. Almost seven in 10 Australian givers (68%) indicated that this is extremely or very significant as a motivation for getting involved. Australians are also highly motivated by organisations that make the world a better place for the less fortunate (54%) and also by their own knowledge of a need (52%).<br><br>THE MOST IMPORTANT COMMUNICATION CHANNELS<br>The most important communication channels in helping Australian charitable givers to engage with causes, Not for Profit organisations and charitable organisations is through word of mouth by way of friends or family members. This was listed as the most influential channel through which Australian givers hear about and engage with charitable organisations, with 39% of Australian givers considering this to be extremely or very important. This validates the ingrained Aussie “scepticism” and our need to hear information from someone we trust in order to fully trust the information we are receiving. Websites are increasingly seen as reliable sources of information with a third (33%) of Australian givers considering these as extremely or very important to them engaging with a charitable organisation.

Australian communities infographic-2016-mccrindle
E N D
Presentation Transcript
H O W A U S T R A L I A N S G E T I N V O LV E D TOP MOTIVATIONS FOR GETTING INVOLVED WITH CHARITIES TOP 7 CAUSES % of Australians highly motivated by this cause MOST OF THESE SUPPORT IN OTHER WAYS TOO 50% 47% 4 in 5 AUSTRALIANS GIVE FINANCIALLY TO CHARITIES / NOT-FOR-PROFITS Children’s charities SUPPORTING VOLUNTEERING 59% Donating goods 46% 68% Know and trust the charity 51% The feeling I get when I volunteer Medical research 45% 34% 44% Animal welfare Volunteering 40% 37% 17% 1 in 4 give at least once a month Disaster reponse in Australia 51% Responsibility to give back to the community 54% To make a better world Fundraising/promoting 33% 13% 35% Disability However, 1 in 5 don’t give at all Raising awareness 32% Homelessness 52% See the need 49% To make a better world 30% 50% COMMUNITY INFLUENCERS 4% GLOBAL 30% Mental health Y For Gen Y the number 1 cause is animal welfare (53%). ADVOCATES THE LONG-TERM ENGAGEMENT CHALLENGE METHODOLOGY Nationally representative survey, n = 1,510. Charity supporter survey, n = 2,688. Not-for-profit staf survey, n = 875. 6 focus groups (Syd & Mel) of charity givers. Expert interviews, n = 14. Australians are twice as likely to... ...give a one-of donation than to donate regularly ...volunteer for an event than be an ongoing volunteer Research and infographic by McCrindle Research c b2016 VS. VS. 40% LOCAL ACTIVATORS 6% OVERSEAS PARTICIPATORS 56% 28% 21% 11% Y Y Gen Y are almost twice as likely to prefer raising awareness (40%) than direct action (23%), but for over 30s it is the reverse. Gen Y are more global in outlook and have less of a focus on local / national (48%) compared to over 30s (61%). Gen Y are more likely to have volunteered for a charity (46%) than over 30s (31%). Gen Y prefer one-of volunteering activities (31% vs. 19% for over 30s), and represent a new approach to volunteering in Australia.
H O W C H A R I T I E S C A N E N G A G E COMMUNICATION CHANNELS % who say this is extremely / very important CHARITIES ARE INCREASINGLY GETTING IT RIGHT Water level = % too much - % too little 57% Just right +9% from 2015 58% Just right +14% from 2015 Australians believe the biggest advertising channel in the next decade will be social media campaigns (29%). 39% 1 Word of mouth 66% Just right +4% from 2015 Y 75% Just right +8% from 2015 This figure is much higher for Gen Y (44%). 33% 2 Website CHANGES AND CHALLENGES IN THE EXTERNAL ENVIRONMENT % who strongly / somewhat agree Y Y 31% Y 3 Television Y 73% 1 Growing gap between rich and poor Y For Gen Y, number 3 is social media (44% vs. 18%). Y Charities are getting the balance right with Gen Y, with equal numbers of Gen Y saying that the frequency of donation requests and the amount spent on administration are either too much or too little. 67% 2 Rising cost of living THE 5 CHARITY ESSENTIALS % who say this is extremely / very important 60% BLOCKERS & ENABLERS TO GIVING 3 72% Younger generations not as generous E M OT I O N A L Administration costs kept below 20% 20% Y Oversaturation of charities Personal connection Not surprisingly, Gen Y view the generosity of the younger generations less harshly (49% strongly / somewhat agree), but it is still almost half. 72% Doubting how much gets through Show impact of individual gift Verification of registration as a charity Already give to people in need Stories of change/impact Role of government funding Frontline participation 71% NET PROMOTER SCORE $ Transparent reporting of admin costs B LO C K E R S E N A B L E R S NPS/NCS = [9+10] - [0+1+2+3+4+5+6] Scores of promoters Scores of detractors Donation requests intrusive Tech-enabled communications 65% AUSTRALIA’S HIGHEST RATED SECTOR Risings costs, variable income Values alignment Where donations are allocated Set amounts/ongoing contracts ‘One-click’ giving NET PROMOTER SCORE (SUPPORTERS) 29 +2 from 2015 Complex giving process Micro-giving, small steps 65% On a scale of 0 to 10, how likely would you be to recommend this organisation to a friend looking for a charity to support? Reporting specific impacts and costs P R AC T I C A L NET CULTURE SCORE (STAFF) 21 On a scale of 0 to 10, how likely would you be to recommend this organisation to a friend looking for a place to work? Y Y Gen Y is less focussed on keeping administration costs below 20%, dropping this to 6th position at 56%. Gen Y desire tech-enabled giving and opportunities to engage with charities by actively participating beyond just giving money.


![Startup Trends 2016 -[Infographic]](https://cdn4.slideserve.com/7336847/slide1-dt.jpg)