The South Pole Telescope Readout System
350 likes | 464 Vues
The South Pole Telescope Readout System. March 4, 2004 SPT EAB Meeting, U. Chicago. OUTLINE Overview of System Technical Challenges Current Status. SPT Readout Team. Matt Dobbs + Helmuth Spieler overall coordination, design, integration, hands on implementation

The South Pole Telescope Readout System
E N D
Presentation Transcript
The South Pole TelescopeReadout System March 4, 2004 SPT EAB Meeting, U. Chicago • OUTLINE • Overview of System • Technical Challenges • Current Status
SPT Readout Team • Matt Dobbs + Helmuth Spieler • overall coordination, design, integration, hands on implementation • LBNL Engineers John Joseph and Chinh Vu • Design, Layout and Commissioning of Osc/Demod and SQUID Controller boards • John Clarke (UCB) and Sherry Cho (postdoc) • SQUID Expertise • UCB Grad Student Trevor Lanting (A. Lee) • Cold Frequency Domain SQUID Multiplexer commissioning and performance • UCB Grad Student Martin Lueker (W. Holzapfel) • SQUID shielding, SQUID Controller commissioning, software • Technician Dennis Seitz • SQUID Quality control and testing (experience from CDMS) • much useful help and discussions from T. Crawford (Chicago) extended visits to LBNL
Readout System Requirements • TES Bolometer Readout • resolve bolometer noise floor (~10 pA/√Hz) SQUID as 1st amplifier stage • maintain voltage bias for low (0.5 Ω) impedance sensor low amplifier input impedance shunt feedback • 1/f knee low enough for drift scanning (~100 mHz) AC bias • Diagnostics • operate SQUID open loop • map SQUID output voltage vs. input current • monitor SQUID DC level during data taking • full spectral distribution for each readout channel • Full computer control
APEX-SZ is SPT Prototype • SPT and APEX-SZ use same readout • sharing of resources between APEX-SZ and SPT readout systems provides SPT with early experience • APEX-SZ is 320 channels • APEX-SZ baseline: no multiplexing • Readout includes all functionality req’d for multiplexing • APEX-SZ timeline (deployment end of this year) means electronics will be available early for SPT • serves as proof-of-concept for SPT • time for modifications / upgrades post-APEX
Implementation • 8-channel SQUID controller • mounted directly on cryostat • full computer control + diagnostics • one cable per 8-ch controller connects to demodulator board • Demodulator + digitizer for each bolometer channel • rack-mounted in receiver cabin • 3 VME crates (9U) for 940 bolometers • 16 demodulator channels per 9U board • each board includes digitization + computer interface • connections to computer optically isolated • Use standard commercial ICs throughout • low cost per channel
Multiplexing • reduce heat transfer through wiring to cold stage • scalability of system to larger arrays • minimize complexity of cold wiring • reduce number of SQUIDs • reduce cost • reduce testing time • minimize Prozac usage • increased dynamic range requirements relative to single bolometer readout
Frequency Domain Multiplexing • complementary to time domain multiplexing • bolometers are AC biased in superconducting transition • fcarrier well above bolometer bandwidth • bolometers grouped in readout “modules”, 8-32 channels • each bolometer in module biased at unique fcarrrier = 0.5-1 MHz • each channel has stand-alone capability (no shared oscillators) • incident radiation (sky signal) causes variation in RBOLO • amplitude modulates carrier • transfers signal power to sidebands (~1kHz bandwidth) • bolometer signals at unique frequencies can be summed in one wire • bias currents are applied as “comb” of carriers one wire for bias module requires 2 wires • frequency-selective demodulation to separate bolometer signals
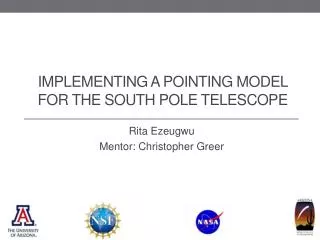
Amplified Demodulated Amp-Modulated by Bolo DDS 200 Hz 200 Hz 500 kHz Shunt FB SQUID 100 Hz f 80 dBc 80 dBc 600 kHz f f f 100 Hz 500 kHz 600 kHz 500 kHz 600 kHz f 500 kHz 600 kHz Frequency Domain Multiplexer fMUX Chip R1 Ln L1 L2 L3 RB DDS Oscillators V1 Cn C1 C2 C3 RS RS RS RS -V2 S Vn(fn) TES Bolometers Rfb I1 R2 I 2 Demodulator ADC SQUID Controller Series Array SQUIDs T=4 K T=0.3 K only 2 wires from cold stage
Frequency Domain Multiplexer fMUX Chip R1 Ln L1 L2 L3 RB DDS Oscillators V1 Cn C1 C2 C3 RS RS RS RS -V2 S Vn(fn) TES Bolometers Rfb I1 R2 I 2 Demodulator ADC SQUID Controller Series Array SQUIDs • Bolometers are AC biased not sensitive to low frequency noise downstream of bolometer • Shunt feedback provides low input impedance to maintain bolo voltage bias for AC carriers • Use of Digital Direct Synthesizers programmable, cheap, and scalable. System is bolo noise limited.
Frequency Domain Multiplexer fMUX Chip R1 Ln L1 L2 L3 RB DDS Oscillators V1 Cn C1 C2 C3 RS RS RS RS -V2 S Vn(fn) TES Bolometers Rfb I1 R2 I 2 Demodulator ADC SQUID Controller Series Array SQUIDs test chip of 8-channel Multiplexer (LBNL, UCB, NGC)
Osc/Demod Readout Board • 16 Channels / board (9u x 400mm) • Separate oscillators for bolo bias + nulling • independent amplitude + phase control • use DDS with common clock (both synchronous) • harmonics, spurious signals < 80 dBc (typ < 100 dBc) • noise sidebands low to 10 mHz. • Sampling Demodulator (+35 dBm IP3) • Parallel channel to monitor SQUID DC output independent of carrier amplitude (flag flux jumping) • 14 Bit ADC’s (4 per 16 channels) • oversampling to obtain dynamic range • one sample-and-hold per channel • Opto-isolated RS485 to PC for Control • SQUID Controller commands passed through • Opto-isolated LVDS to • Custom digital PCI I/O board in PC (FNAL design) • data push at 7 Mbits /s (about 1000 channels x 2.5 kHz = 6 Mbits/s) • Power ~80W per board.
Warm Cabling and Mechanics • 9U Osc/Demod boards housed in VME 64x Crates with custom backplanes • 20 boards (16 ch ea.) / crate, 3 crates • 1 clock distribution board per crate • Warm Cabling • commercial 10’ SCSI differential cables (Cryostat Readout boards), twisted pairs in common shield • LVDS twisted pair to PC • Power: • 5 kW for 60 boards = 920 Channels • commercial 250 kHz switching power supplies, 1% Vp-p Ripple
8ch SQUID Controller • 8 channel SQUID controller • shunt feedback • switch open loop/closed loop w. switchable gain, • on board FPGA / DAC for programming SQUID • mates directly to cryostat • analog data out to demodulator boards. 19mm pitch Cold Warm RFB MOSFET Signal IN enoiseamp 100 VΦ Lin 104 10 Min 100 • Not Shown: • DC Squid bias • DC Flux bias • DC Amp Voltage Offset • SQUID Voltage measure lead
SQUID pre-amplifers • Measure current in SC loop of LCRbolo • 100 element Series array SQUIDs from NIST • AC biased 1/f noise unimportant • Squid Noise: 0.1 μΦ0/√Hz ≈ 2 pA/√Hz, adequate • Expect to receive first two wafers from NIST next week (destined for APEX-SZ) • Quality control and testing at Berkeley by Dennis Seitz (experienced with NIST arrays for CDMS) ZTrans= 400 Ω PUT NIST DRAWING HERE. Flux Bias
SQUID Magnetic Shielding • Two part shielding • 0.056’ Cryoperm chimney style shield (attenuates B, by few 103 • Nb film (pins B field lines, by >15) • Measured performance (prototype) • DC attenuation of few 105 • improves to >106 for AC B fields • Production Drawings near-ready • Finalizing Mechanical support/connetors Calculated Attenuation from Nb Foil (Martin Lueker)
Nb2O5 capacitors lossy, spoils voltage bias. • Solution: use external NP0 ceramic chip caps.
MUX LC Chip 1st Generation MUX Chip Integrated LC’s. 8 channels 1/3 Q 2nd Generation MUX Chip New Mask for MUX chip, inductors only • Fabricated by • Smith, • Northrop Grumman Space Tech
Loss in LC OLD LC Chip New L chip, with Surf mount caps
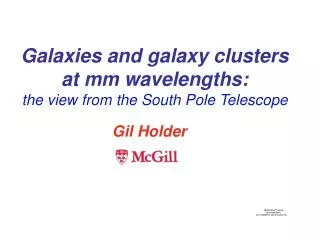
NOISE OF SENSOR JUST ABOVE ITS TRANSITION (HIGH VOLTAGE BIAS) WITH CMB ELECTRONICS (fbias=1.5 MHz) 100 Hz Sky signal 1/f dominated by active filter in demodulator fixed in new Tayloe mixer measured noise as calculated
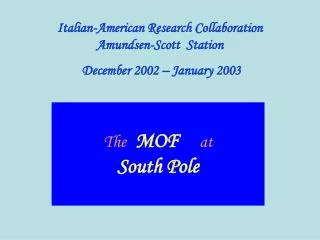
NOISE OF SENSOR IN TRANSITION WITH 100Hz SIMULATED SKY SIGNAL WITH CMB ELECTRONICS (fbias = 1.5 MHz)
Readout Challenges • dynamic range: >80 dB for single bolometer • high Q LC resonator • solved- custom Nb inductors + NP0 chip capacitors • intermodulation distortion • new Tayloe Mixer (35 dBm IP3) • requires (passive) nulling of bolometer carriers at SQUID input • low frequency response • measured DDS stability, good to 10 mHz • low noise Tayloe Mixer • cold SQUID + warm amplifier feedback loop • requires short cold-warm wiring lengths
Intermodulation Distortion and Nulling • Carrier inter-modulation products troublesome. • Can avoid them or NULL the carriers to minimize their effect • Carrier nulling at 60 dB obtainable, accurate to 10 mHz. • New TAYLOE Mixer on demodulator board has excellent IP3=35 dBm.
ColdWarm Wiring Lengths Rfb I1 SQUID Controller Series Array SQUIDs • SQUID locked in feedback loop w/ warm amp • Loop gain determines dynamic range. • original goal: ALOOP=100 at 1 MHz ALOOP=1 at 100 MHz • need to maintain phase margin at freq. where ALOOP>1 • limits wiring length between cold and warm • depends on max bias freq. x loop gain • Example: ALOOP=100 at 1 MHz round trip wiring length <20 cm for 45 deg phase margin • SQUID arrays relax dynamic range requirements • Loop gain requirement set by SQUID non-linearity (intermodulation products) -- t.b.d. for NIST arrays • achieved wire length is 2x 15 cm • can achieve ALOOP = 50 with some margin • carrier nulling reduces max. signal -- essential COLD | WARM
SPT Readout Status • SQUIDs • sample 8-turn NIST arrays tested with our system • first production SQUIDs arriving at Berkeley this month • SQUID Shields • prototypes fabricated at Amuneal • attenuation measured – adequate • designing production cryoperm shields now • Cold wiring harnesses • prototypes ordered from TechData • SQUID Controllers • 4-channel analog and 8-channel digitally controlled prototypes tested (testing of 8-ch board continues) • Layout revisions of production boards begun • Warm cabling • off the shelf SCSI cables, samples procured
SPT Readout Status • Oscillator/Demodulator Readout Boards • Prototype single channel board fabricated and tested • Tayloe Mixer tested as add-on board • Prototype 16 channel board fabricated • functionality verified, need to measure performance, test with system • VME Crates selected (Wiener), off-the-shelf power supplies selected • Custom backplanes: power plane finished, signal/clock plane underway. • Firmware • slave board firmware written/tested • SQUID Controller / Master board firmware will start soon • Clock Distribution Board • prototype fabricated and tested • 9U prototype in the pipeline (very simple board) • Digital IO Board • “borrowed” Custom IO boards from Fermilab, 2 boards in hand • Readout Software • OO software in C++ on Linux OS, interfaced with experiment Software via TCP/IP • High Level Design Sketches/Brainstorming • Many low level Hardware interfaces and tuning algorithms written and in use.
Readout Status – System • individual elements of readout system prototyped and tested • early prototype integrated readout system tested with bolometer • analog SQUID controller, single channel demodulator… • noise properties and two channel fMUX tested • commissioning 8 channel system with bolometers now • testing of “production ready” integrated system forthcoming (this spring/early summer)
The South Pole TelescopeReadout System Software March 4, 2004 SPT EAB Meeting, U. Chicago
Framework / Infrastructure • Programming in C++ on Linux OS • Communication w/ Outside world via TCP/IP only. • Dedicated PC for Data Acquisition, receives digital data from readout boards, and makes it available on sockets for SPT control PC to archive (rates up to 100-400 Hz, TBD) • also supports streaming data directly to disk at rates up to 2.5 kHz, for debugging, etc. • Readout Tuning and Monitoring PC • algorithms to setup and tune SQUIDs/Bolometers • monitors noise and DC levels (flux jumping) in all channels • knows algorithms to repair channels • provides quality control data on sockets for SPT archive
Sampling Rate of Bolo Timestream • sampling pulse can be generated externally or internally • the maximum bandwidth is determined by the bolometer time constant (hardware allows us to reduce bandwidth below 1 kHz) • Bolometer time constant ~ 1 ms (not well known yet!) • bandwidth 1/(2πτ) = 160 Hz • by low pass filtering the bolometer timestream at 160 Hz, and sampling at the Nyquist frequency 400 Hz, all the timestream information is encoded • we sample with a 14 bit ADC, providing a LSB accuracy of ~10-4. • Why use the full bandwidth when the sky signal will be modulated at slower rates? • we can gain further accuracy by over-sampling • Sampling beyond bolometer 3 dB bandwidth allows full reconstruction of signals within MUX bandwidth for diagnostics. • Data storage rate can be reduced by real time averaging during measurement can be done in FPGA on demodulator board can keep high sample rate and reduce readout rate.
Data Flow Cartoon Control and Monitoring Computer (might be same PC) receiver housekeeping data read/write controls & time stamp RS 485 Serial subset of data for online monitoring & SQUID / Bolo tuning Data pushed at few MBytes / s To SPT Archive PC DAQ Computer Oscillator/Demodulator Boards (optically isolated from PC / GPS)
Data Rate • Between readout boards and PC size of frame for one sample: 2.9 kBytes(of which about 40% is header information– see cartoon of frame on next slide) • 400 Hz sampling rate 1.1 MBytes / second • 2.5 kHz sampling rate 7.1 MBytes / second • Data rate written to disk (bolo data only) • 400 Hz 0.74 MBytes/s (62 GBytes / 24 hrs) • 100 Hz 0.18 MBytes /s (15.5 GBytes / 24 hrs)
Size of Data Frame: 2.9 kBytes 3 crates Data Frame from Osc/Demodulator 1 Byte CRATE ID 9 Bytes GPS Time Data from one Crate 20 boards/crate 1 Byte BOARD ID Data from one Osc/Demod Board 16 channels/board 1 Byte CHANNEL ID 2 Bytes 14 bit data sample
Block Diagram: Bolo Data Flow 60 x 16ch Boards in 3 9u Crates we are free to average some number of data samples here, while still maintaining benefits of oversampling. Osc/Demodulator Boards 15 x (8 Mod x 8ch) Boards Comb of Carriers 16 DDS Oscillators for Carriers Data Acquisition PC Digital IO Board With FPGA 2 MByte Buffer Control FPGA SQUID Controller 8 MUX Modules / board Data Cable: Diff. Twist Pair ≤ few MBytes/s Opto-Isolators 16 DDS Oscillators for Nulling Comb for Nulling PCI Interface PC Memory Software Processing ADC’s Bolometer time stream 1 MHz BW 16 Demodulators Data Reduction Bolometer time stream 1 kHz BW time interval of encoded data need only be larger than signal bandwidth, ~ 100 Hz. ≈0.2 MB/s Provides GPSTimestamp Persistent Storage on Hard Disk & Ultrim Tape Legend Control & Bolo / SQUID Tuning Comment Flow of Control Commands Flow of Bolo Data Control (and Monitoring?) PC Flow of Timing Info RS 485 IO Differential & Isolated Subset of Data for Monitoring PC Memory Software Processing External SPT Sampling Clock Housekeeping Data Readout Hardware accommodates both of these timing Possibilities. IRIG-B GPS Signal