Download
1 / 11
110 likes | 218 Vues
The WRAP Workshop on May 15, 2008, focused on advanced monitoring and data analysis tools relevant for regional air quality assessments. Key discussions included identifying effective monitoring networks for WRAP, exploring regulatory compliance tools beneficial to states and tribes, and analyzing pollutants like PM, ozone, mercury, and nitrogen deposition. Various conceptual examples were presented, such as PM2.5 pollutant roses, ozone timelines, and dynamic contour maps. These tools aim to enhance understanding of air quality issues across urban and rural landscapes. ###

E N D
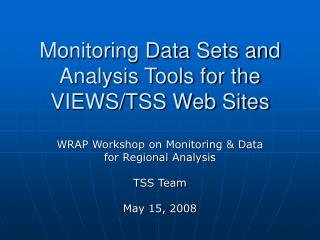
Monitoring Data Sets and Analysis Tools for the VIEWS/TSS Web Sites WRAP Workshop on Monitoring & Data for Regional Analysis TSS Team May 15, 2008
Additional Pollutant/Met Data and Analysis Tools for VIEWS/TSS Web • Which networks (& what parameters) provide the most useful data for WRAP? • What tools related to regulatory compliance would most benefit states and tribes? • What other analyses for PM, ozone, mercury and nitrogen deposition do states need? • Following examples are CONCEPTUAL – don’t get hung up on the details
Summer Hourly PM2.5 Pollutant Rose and Daily PM2.5 1. Summary of hourly data in pollutant rose – what directions do high hourly PM2.5 events come from and how often?2. Summary of daily PM2.5 vs. daily standard for same time period Daily Standard
O3 and Nitrogen Plume Differences, Urban vs. Rural 1. Ozone timeline for July 2004 at an urban (top) and rural (bottom) site in Georgia.2. Timeline of the NOx/NOy ratio below the ozone trace. This ratio can be used to determine if the nitrogen oxide plume is recent or aged. Ratios close to 1 imply fresh emissions; ratios less than 1 imply increasing age with lower value.3. Note the differences between the urban and rural traces: - Higher urban O3 peaks; lower urban O3 at night - Older plume assumed at rural site based on NOx/NOy ratio
Dynamic Contour Maps A single contour map combining networks would enhance the understanding of sulfate across the country by including both rural and urban areas, and significantly increasing the site density.
Ozone Site Selection and Regional Overview (1) 2006 4th highest 8-hour averages at non-urban sites Metric Selection for Data Bubbles NAAQS Exceedances: > 4th highest 8-hr average (select YR) > No. of exceedances (select YRs) NAAQS Violations: > 3-yr avg. 4th highest 8-hr avg. (select YR) > No. of violations (select YRs)
Ozone Site Selection and Regional Overview (2) 1. Select site to pull up ozone and associated data from multiple nearby networks. 2. Refine time period selection (next page) to review specific episodes. Wind Cave NP, SD ~ O3 ~ WD Badlands NP, SD Campbell County, WY Thunder Basin National Grasslands, WY
Wind Cave NP, SD Network ~ O3 ~ WD Badlands NP, NPS Network Campbell County, WY DEQ Network Thunder Basin National Grasslands, WY DEQ Network Ozone Site Selection and Regional Overview (3) Ozone and wind direction data from nearby sites (three separate networks) are shown for about 1 week around the highest 8-hr ozone measured at Wind Cave in 2006.
Monitoring Data Summary 4/30/2008 Max WS Site 1 Max WS Site 2 Site 1 Site 2 SX-EW Sanctuary Site 1 Site 2 Site 3 Site 4 Particulate Concentration Summary Flash Movie goes here (Four Peeks) Red dots indicate that all 15-minute average wind directions for that hour came from the same direction (petal) on a 16-point wind rose. Sparklines are scaled to the maximum wind speed for the entire period.