Download
1 / 23
230 likes | 253 Vues
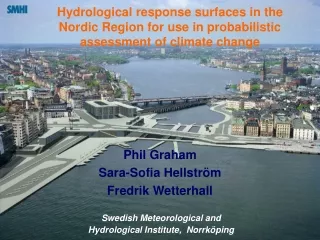
Hydrological response surfaces in the Nordic Region for use in probabilistic assessment of climate change. Phil Graham Sara-Sofia Hellström Fredrik Wetterhall. Swedish Meteorological and Hydrological Institute, Norrköping. Our contribution to workpackage objectives.

E N D
Hydrological response surfaces in the Nordic Region for use in probabilistic assessment of climate change Phil Graham Sara-Sofia Hellström Fredrik Wetterhall Swedish Meteorological and Hydrological Institute, Norrköping
Our contribution to workpackage objectives • Hydrological rainfall-runoff models to investigate impacts of climate change on stream discharge • Using the climate change signal from RCMs
Our contribution to workpackage objectives • Response surfaces for selected applications • Direct use of multiple regional model projections • Comparison of outcomes from the two methods
What have we achieved since Lund? • In Lund, we showed some preliminary response surfaces • Now, we have produced many more • In Lund, we discussed the question of seasonality • Now, we have investigated the details of representing seasonality
Response Surfaces – Annual Runoffno seasonality Lake Vänern Lake Vänern
Response Surfaces – Annual Runoffwith seasonality Lake Vänern Lake Vänern
RS – Representing SeasonalityMethod 1 Temperature Precipitation
RS - Extended Period with Maximum Discharge Lake Vänern Current regulation rules
RS - Extended Period with Maximum Discharge Lake Vänern Current regulation rules
Lake Vänern RS - Extended Period with Maximum Discharge with Modified Regulation Modified regulation can help reduce risk of high discharge
Lake Vänern Response Surfaces – Monthly Runoff Lake Vänern
Response Surfaces – Annual Runoff Lake Mälaren
Response Surfaces – Annual Runoff seasonality 1 Lake Mälaren
Response Surfaces – Annual Runoff seasonality 2 Lake Mälaren
RS – Representing SeasonalityMethod 2 Precipitation method 1 Precipitation method 2
RS – Lake Levels Lake Mälaren Low levels
RS – Lake Levels, seasonality 1 Lake Mälaren Low levels
RS – Lake Levels, seasonality 2 Lake Mälaren Low levels
Response Surfaces – Monthly Runoff Lake Mälaren
Monthly Runoff – compared to previous results Lake Mälaren
Some Conclusions • Seasonal differences not so apparent for annual runoff • Shows up in monthly results, and even more for thresholds, although not all basins are equally sensitive • Different methods for representing seasonality have an impact • Representation of evapotranspiration is problematic (as usual!)
Coming Work • Contribution to del. 6.7 (RS Report) • Not too much more on response surfaces before data starts coming • Next major effort will be to work with direct modelling of RCM simulations (the “Matrix,” as soon as they are available)
Questions for Discussion • Critical thresholds, we use experience from critical past events, better ideas? • What if there is widely differing seasonality from the climate models? • What will we actually get from the climate models (i.e. probabilistic info.)? • How many simulations will be available (perturbed vs. RCM results)?