Download
1 / 48
480 likes | 628 Vues
Collecting and Reporting Accurate Data. Three States Discuss Their Strategies for Advancing Data Quality. Do you know who I am?. I have a student profile. I am a Person. I have a SIS File. I have a Special Education file. The data is me.

E N D
Collecting and Reporting Accurate Data Three States Discuss Their Strategies for Advancing Data Quality
Do you know who I am? I have a student profile I am a Person I have a SIS File I have a Special Education file
The data is me Thank you for being my voice and ensuring others see the real me
Who are we? • Bonnie Dye • Georgia • Nick Easter • Kentucky • Shiyloh Duncan-Becerril • California
Kentucky • 97,500 Students • 173 LEAs • 2 State Schools
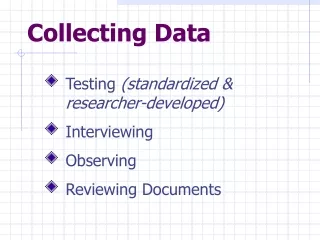
Data Collection System • Kentucky is Local Control---However, it was mandated that all LEAs use the same vendor for their Student Information System (SIS).
Student Information System Authoritative Source for • Student Demographics • Attendance • Behavior • Health • Grades, GPA, & Graduates • Teacher Identifiers • Courses • Class Rosters linking students to teachers • School/District • Superintendents & Principals • Program Participation • -Gifted & Talented • -Title I • -LEP • -Free/Red. Lunch • -Preschool • -Migrant • -K-Readiness • -Prior Setting • 17958 Data Elements • 315 SpEd Data Elements
Guidance: Training • Regional Trainings via 9 Special Education Cooperatives • Online Trainings • Data Steward Trainings
Data Standards • Data Standardization is the process of making all data of the same type or class conform to an established convention or procedure to ensure consistency and comparability across different databases. • Data Standards are linked to website and to SIS. • Promote the use of procedures, guidelines for consistency for new initiatives and to improve data quality.
Data Stewards • Data Steward: owner of a data element or data field responsible for hands-on work related to data at KDE. • That person and office should (a) be the expert of what that particular data element means/does, (b) is the person/office that answers detailed questions/issues about that data element and (c) lastly regularly inspects (you get what you inspect versus expect) the level of quality to ensure it meets not only their office needs but all the others that depend on it. • The data steward for each key data element arrives each day knowing they have the responsibility for the accuracy of each data element that they have been assigned for not only their office but others outside their office that count on it.
Data Stewards • Recognize the Authoritative Source of the Data • Utilize Authoritative Source Systems • Systems should communicate • Avoid duplicate collections of data. • Validate and update data within authoritative source sytem. • Data stewards need to know and understand data. • Should know how data is used agency wide. • Verify reasonability • Follow-up on issues to improve data quality. • Promote the use of procedures, guidelines for consistency for new initiatives and to improve data quality. • Historically – Legislatively Required • NOW – best practices • Verify/Validate - completeness
Student Information System Technical Assistance Weekly Snapshot District Edition Districts enter data into LEA SIS Sync Weekly Real Time Sync State Edition SEA SIS links to all LEA SIS Sync Weekly
SEA Validation Real Time Sync
Data Validation via Public Reporting • Kentucky’s School Report Card • http://applications.education.ky.gov/SRC/ • Each year, School and District Report Cards are posted on the Kentucky Department of Education’s (KDE's) website and provide information about each school and district, including test performance, teacher qualifications, student safety, awards, parent involvement and much more.’ • LEAs have a data verification window to check data and make corrections either via the SRC data collector or by correcting the SIS and resubmitting the report.
California • 705,000 Special Education Students • 1700 Districts (LEAs) • 139 SELPAs
Data Collection System • California Special Education Management Information System (CASEMIS) • 2 data collections per year from LEAs • California is Local Control---Each LEA contracts with a vendor for a Student Information System (SIS) and an electronic IEP system • Two separate systems at both the LEA and the state level
All Other Student Data Special Education Data SELPAS
Current Data Submission Structure • Data • State and Federal Reporting • Certification • Extraction • Data • Data • LEAs • SELPAs • CDE
Data Validity Concerns Is data being entered correctly? Does everyone who enters the data have the same understanding? Are all SWD being reported? Are all events being reported? Are there explanations for anomalous data? Where are discrepancies?
Data Concerns • Accuracy • Alignment to other data • Consistency in reporting fields • Training for field colleagues on needs and expectations • Lack of Data Culture
The Data Validation Process • Phase III • Phase I • Technical Assistance Guides • CASEMIS Training • CASEMIS Help Team • Software based Validation • Anomaly Review • Warning Review • On-time Submission • Cross-Validation • Other Analysis • Data Validation Review • Phase IV • Pre-Validation Stage • Phase II
Example in Practice • Pre-Validation • CASEMIS Technical Assistance Guide • Published twice per year • Regularly updated • CASEMIS Help Team • In-Person Trainings (CASEMIS Roadshow) • Webinars
Example in Practice • Cross-Validation of Data • Discipline data collected in two separate systems • Did not match up • Engaged with our stakeholders to develop solutions
Making SELPA and LEAs Partners • Work collaboratively • Build Trust • Be Consistent but Flexible • Be Open to Their Concerns • Lead by Example • Hold Accountable • Find the WIIFM
Working with General Education • Open Lines of Communication • Be the teacher • Show up to every invite • Use your voice at meetings • Get executive buy-in • Find common ground • Be appreciative
Now…. • We are engaging in a process in which everyone has a voice • We are creating a culture of data • We can tell the story more accurately
21,147 SpEd Teachers/ Related Service Providers 21 Data Collections 6 SpeED Data Applications 190,587 Students with Disabilities 1100 Business Rules 700+ Data Elements 26,000 Helpdesk Calls 12 Month Collection Period 1,723,439 Students 2263 Schools 198 LEAS
EDFacts Reporting SPP/APR Special Education Data Applications Georgia Data Collections Division All Files Preschool Outcomes (Indictor 7) Transition Planning (Indicator 13) Postsecondary Outcomes (Indicator 14) CEIS (Table 8) 618 Data State Reporting Overview of Georgia’s Data Reporting
Strategies for Advancing Data Quality Written Guidance Business Rules Errors and Warning Data Reports
Drilldown on Student ID to View Student Level Data Was this a continuation of the same action?
Ongoing Technical Assistance Phone Calls Preschool Outcomes Collection Tool Data Conference Age 3-5 Environment Calculator Age 6 -21 Environment Calculator Help desk Warnings/Errors Monthly TA Calls Help Desk Data Collection Worksheets Special Education Leadership Conference Data Reports Special Education Leadership Academy Emails GOIEP GLRS/ District Liaison Training Friday Blast Year to Year Change Reports
Georgia EDFacts Database Reports for Program Office Review Category Sets SEA Total Records by: Category Set Subtotal Total SEA, LEA, School Cell by Cell Analysis Submission Reports Submission Logs Specialty Reports Prior Year Comparison Reports 175,178,185,188,146 & 004 Summary Assessment Results by Disability Area SEA, LEA, School Nsize and % Change Cell by Cell Analysis
SEA LEA School
School Level Environment Age Student Count Disability LEA School
Current Year Prior Year Count Difference % Difference
SEA Student Count Age (3, 4, 5) Race/ Ethnicity
Total Enrollment 15,931 Minus Medical 15,390 Non-Part 60 Performance 15,870 Assessment Congruency Report
All Assessments Assessment Congruency Report ALT/ALT Participation 1,254 Performance By Level Total Performance 1,264 Difference= 0 Total Proficient
Calculates Caps Based on Count Proficient to Enrollment Reports Count Over/Under Cap Congruency Check Between Non-Part in N185 and N188 Compared to Reasons for Non-Part in N004 Congruency Check Between N185 and N188 Compared to N175 and N178