Download

1 / 24
240 likes | 369 Vues
This document summarizes the evaluation of MongoDB for monitoring data within the ALMA observatory's computing framework. It addresses the requirements for storing and querying vast amounts of monitoring data generated by 66 antennas, which amounts to approximately 150,000 monitor points and significant data rates. Various database options were assessed, revealing key advantages of MongoDB, including its no-SQL structure, document-oriented storage, and flexible querying. The proposal of using specific data schemas and performance testing highlights the potential for MongoDB in high-volume data management at ALMA.

E N D
Summary of Alma-OSF’sEvaluation of MongoDBfor Monitoring DataHeiko SommerJune 13, 2013Heavily based on the presentation byTzu-Chiang Shen, Leonel Peña ALMA Integrated Computing TeamCoordination & Planning Meeting #1Santiago, 17-19 April 2013
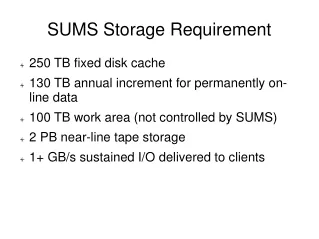
Monitoring Storage Requirement • Expected data rate with 66 antennas: • 150,000 monitor points (“MP”s) total. • MPs get archived once per minute • ~1 minute of MP data bucketed into a “clob” • ~ 7000 clobs/s ~ 25 - 30 GB/day, ~10 TB/year • 2500 clobs/s + dependent MP demultiplexing + fluctuations • ~ equivalent to 310KByte/s or 2,485Mbit/s • Monitoring data characteristic • Simple data structure: [ID, timestamp, value] • But huge amount of data • Read-only data
Prior DB Investigations • Oracle: See Alisdair’s slides. • MySQL • Query problems, similar to Oracle DB • HBase (2011-08) • Got stuck with Java client problems • Poor support from the community • Cassandra (2011-10) • Keyspace / replicator issue resolved • Poor insert performance: Only 270 inserts / minute (unclear what size) • Clients froze • These experiments were done “only” with some help from archive operators, not in the scope of a student’s thesis like it was later with MongoDB. • Also “administrational complexity” was mentioned, without details.
Very Brief Introduction of MongoDB • no-SQL and document oriented. • The storage format is BSON, a variation of JSON. • Documents within a collection can differ in structure. • For monitor data we don’t really need this freedom. • Other features: Sharding, Replication, Aggregation (Map/Reduce)
Very Brief Introduction of MongoDB … A document in mongoDB: { _id: ObjectID("509a8fb2f3f4948bd2f983a0"), user_id: "abc123", age: 55, status: 'A' }
Schema Alternatives1.) One MP value per doc • One MP value per doc: • One MongoDB collection total, or one per antenna.
Schema Alternatives2.) MP clob per doc • A clob (~1 minute of flattened MP data): • Collection per antenna / other device.
Schema Alternatives3.) Structured MP /day/doc • One monitor point data structure per day • Monthly database • Shard key = antenna + MP, keeps matching docs on the same node. • Updates of pre-allocated documents.
Analysis • Advantages of variant 3.): • Fewer documents within a collection • There will be ~150,000 documents per day • The amount of indexes will be lower as well. • No data fragmentation problem • Once a specific document is identified ( nlog(n) ), the access to a specific range or a single value can be done in O(1) • Smaller ratio of metadata / data
How would a query look like? • Query to retrieve a value with seconds-level granularity: • Ej: To get the value of the FrontEnd/Cryostat/GATE_VALVE_STATE at 2012-09-15T15:29:18. db.monitorData_[MONTH].findOne( {"metadata.date": "2012-9-15", "metadata.monitorPoint": "GATE_VALVE_STATE", "metadata.antenna": "DV10", "metadata.component": "FrontEnd/Cryostat”}, { 'hourly.15.29.18': 1 } );
How would a query look like … • Query to retrieve a range of values • Ej: To get values of the FrontEnd/Cryostat/GATE_VALVE_STATE at minute 29 (at 2012-09-15T15:29) db.monitorData_[MONTH].findOne( {"metadata.date": "2012-9-15", "metadata.monitorPoint": "GATE_VALVE_STATE", "metadata.antenna": "DV10", "metadata.component": "FrontEnd/Cryostat”}, { 'hourly.15.29': 1 } );
Indexes • A typical query is restricted by: • Antenna name • Component name • Monitor point • Date db.monitorData_[MONTH].ensureIndex( { "metadata.antenna": 1, "metadata.component": 1, "metadata.monitorPoint": 1, "metadata.date": 1 } );
Testing Hardware / Software • A cluster of two nodes were created • CPU: Intel Xeon Quad core X5410. • RAM: 16 GByte • SWAP: 16 GByte • OS: • RHEL 6.0 • 2.6.32-279.14.1.el6.x86_64 • MongoDB • V2.2.1
Testing Data • Real data from Sep-Nov of 2012 was used initially, but: • A tool to generate random data was implemented: • Month: 1 (February) • Number of days: 11 • Number of antennas: 70 • Number of components by antenna: 41 • Monitoring points by component: 35 • Total daily documents: 100.450 • Total of documents: 1.104.950 • Average weight by document: 1,3MB • Size of the collection: 1,375.23GB • Total index size 193MB
More tests • For more tests, see https://adcwiki.alma.cl/bin/view/Software/HighVolumeDataTestingUsingMongoDB
TODO • Test performance of aggregations/combined queries • Use Map/Reduce to create statistics (max, min, avg, etc) of range of data to improve performance of queries like: • i.e: Search monitoring points which values >= 10 • Test performance under a year worth of data • Stress tests with big amount of concurrent queries
Conclusion @ OSF • MongoDB is suitable as an alternative for permanent storage of monitoring data. • Reported 25,000 clobs/s ingestion rate in the tests. • The schema + indexes are fundamental to achieve milliseconds level of responses
Comments • What are the requirements going to be like? • Only extraction by time interval and offline processing? • Or also “data mining” running on the DB? • All queries ad-hoc and responsive, or also batch jobs? • Repair / flagging of bad data? Later reduction of redundancies? • Can we hide the MP-to-document mapping from upserts/queries? • Currently queries have to patch together results at the 24 hour and monthly breaks.