Download
1 / 25
250 likes | 368 Vues
This study analyzes spatial and temporal variability in land surface precipitation from 1900 to 2006 using high-resolution datasets. It emphasizes the necessity for detailed precipitation data for climate research, with a focus on three datasets: University of Delaware, CRU, and GPCC. Various interpolation methods, including climatological and spherical approaches, are reviewed. The findings highlight notable trends and changes in precipitation patterns across different regions, generating a comprehensive understanding of climatic impacts related to land surface dynamics.

E N D
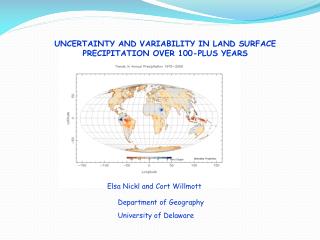
UNCERTAINTY AND VARIABILITY IN LAND SURFACE PRECIPITATION OVER 100-PLUS YEARS Elsa Nickl and Cort Willmott Department of Geography University of Delaware
Understanding the spatial and temporal variability of land-surface precipitation: indispensable for climate research Spatial mean of land surface precipitation for 1900-2006 period University of Delaware, Willmott and Matsuura dataset
Land Surface Precipitation Fields Datasets (based on in situ observations) • A growing demand for higher spatial (e.g. 0.5o ) and temporal (e.g. monthly, daily) resolution gridded datasets • Currently there are three land surface monthly precipitation datasets for the period 1901-2006 at 0.5o resolution: • Climate Research Unit (CRU) dataset • University of Delaware (Udel or Willmott and Matsuura) archive • Global Precipitation Climate Center (GPCC) dataset
Low spatial density of weather stations in complex terrain regions (e.g. mountainous regions)
OBJECTIVES To explore the spatial and temporal variability of land-surface precipitation using three current high resolution gridded datasets. To propose a new approach for estimating monthly land-surface precipitation fields from rain gage station records • DATA • Gridded monthly land-surface precipitation (1901-2006) at 0.5o resolution from: Udel archive, GPCC dataset and CRU dataset • US monthly land-surface precipitation (2001-2005) from the National Climatic Data Center (NCDC) • Central Peruvian Andes land-surface precipitation climatologies (1965-2000) from ELECTROPERU. • Digital Elevation information at 2.5 minutes resolution (used by PRISM, derived from EROS Data Center 3 arc sec) (US area) • Digital Elevation information at 0.5 minute resolution from GTOPO30 (Peruvian Andes area)
INTERPOLATION METHODS Udel archive (Matsuura and Willmott) 1900-2006 Gridded Monthly Time Series • Climatologically Aided Interpolation method • High-resolution climatology • Monthly precipitation differences at each station • Station differences are interpolated to a gridded field using Shepard’s algorithm • Each gridded difference is added back onto the corresponding climatology
INTERPOLATION METHODS Climate Research Unit dataset (1901-2002) • Angular Distance Weighted (ADW) interpolation • Weights 8 nearest stations from the grid point (using a Correlation Decay Distance and the directional isolation of each station) • At grid points where there is no station within CDD, interpolated anomalies • are forced to zero (as a consequence, estimated time series over some areas • are invariant for many years) Number of years since 1901 with repetitive information
INTERPOLATION METHODS Global Precipitation Climatology Project (GPCC, 1901-2006) • SPHEREMAP interpolation tool (developed by Wilmmott and his graduate students) • It’s an spherical adaptation of Shepard’s algorithm • Shepard’s takes into account: • Distances of the stations to the grid point (limited number of nearest stations) • Directional distribution of stations (to avoid overweighting of clustered stations) • Spatial gradients within the data field in the grid-point environment
TEMPORAL VARIABILITY OF LAND-SURFACE PRECIPITATION • Similar trends until the end of 1970s (except GPCC) • Early 1980s datasets show a decline with a “recovery” of 2 datasets (CRU and GPCC) in the early 1990s. Udel dataset remains negative until 2006
Udel SPATIAL VARIABILITY OF LAND SURFACE PRECIPITATION (1901-1976) • Slight increases over many areas, with some very large • increases apparent in Udel and GPCC datasets, especially • over the Amazon Basin • A large but questionable decrease over the Tibetian Plateau GPCC CRU
Udel SPATIAL VARIABILITY OF LAND SURFACE PRECIPITATION (1977-2002) • Udel and GPCC datasets show decreasing land-surface • precipitation over many regions of North America, Central • America, Central South America, equatorial Africa and the • maritime continent • These patterns are not present with CRU dataset to the • same extent GPCC CRU
PRECIPITATION CHANGE AND TELECONNECTIONS (taking into account change-point method) 1965-1975 Change-point regression (Draper and Smith, 1981): to identify the years of major change. This method determines optimal change-point in time-series by minimizing the sum of squared residuals of all possible change-point regressions 1976-2000
NEW METHOD OF INTERPOLATION • Parameter-elevation Regressions on Independent Slopes Model (PRISM) : • Linear relationship between precipitation and elevation • Estimated orographic elevation • “Facets” (contiguous areas of homogeneous slope orientation) Exploration of the relationships between monthly precipitation and the spatial arrangements of topographic patterns: Central Peruvian Andes Western US
NEW METHOD OF INTERPOLATION Summer (JJA) Winter (DJF) Elevation and seasonal precipitation (with more than 200mm) in the Western US
NEW METHOD OF INTERPOLATION “Special” scatterplots: To explore relationships between spatial arrangements of elevation, slope, slope orientation and precipitation Winter (DJF) Western US, 2.5 min resolution: Winter: Not apparent relationship High precipitation values at elevations <1km Summer: Most precipitation is convective Summer(JJA)
NEW METHOD OF INTERPOLATION Central Peruvian Andes, 0.5 min resolution:
NEW METHOD OF INTERPOLATION Identification of the “orographic scale” Averaging up from a high-resolution DEM to a more coarse spatial resolution Adjustable-scale spatial ellipse (to estimate areal extent of orographic influence)
NEW METHOD OF INTERPOLATION 7.5 min Western US: Elevation, slope, slope orientation and precipitation during winter (DJF) A slight relationship between higher winter precipitation and SW and NE orientations at elevations greater than 1km. 12.5 min
NEW METHOD OF INTERPOLATION San Joaquin Valley and Sierra Nevadas: Elevation, slope, slope orientation and precipitation during winter (DJF) 7.5 min A moderate relationship between higher winter precipitation and W and SW orientations at elevations greater than 500 meters. 12.5 min
NEW METHOD OF INTERPOLATION 1.5 min Central Peruvian Andes: Elevation, slope, slope orientation and precipitation during austral summer (DJF) Localized relationship between higher precipitation values and NE slope orientations, especially at 2.5 min resolution 2.5 min
NEW METHOD OF INTERPOLATION Central Peruvian Andes: Elevation and precipitation for low and high slope values
( NEW METHOD OF INTERPOLATION • Horizontal-distance and direction influences (based on modified Shepard’s • interpolator) from nearby stations Pi • 2. Additional topographic influences on interpolated precipitation (from elevation, • slope, slope orientation and the degree of exposure to orography • Important: the orographic scale • Orographic elevation • Longitudinal and latitudinal components of the slope of the orographic region • Potential exposure of station “i” to orography • We can estimate an interpolation bias for each station: Then we can estimate And finally:
CONCLUSIONS • The spatial and temporal variability of land-surface precipitation • over the last 100-plus years is uncertain, as is evident in the differences • between available gridded datasets • The relationships between spatial arrangements of topographic patterns • and precipitation in mountainous regions are stronger for more coarse spatial • resolutions. • A central aspect of the new interpolation method is to estimate the areal extent • of orographic influence (orographic scale) • Understanding the spatial and temporal variability of land surface precipitation • and precipitation change is useful for teleconnection analysis in Central Peruvian Andes