Download
1 / 10
110 likes | 244 Vues
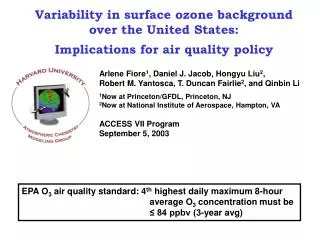
Variability in surface ozone background over the United States: Implications for air quality policy. Arlene Fiore 1 , Daniel J. Jacob, Hongyu Liu 2 , Robert M. Yantosca, T. Duncan Fairlie 2 , and Qinbin Li 1 Now at Princeton/GFDL, Princeton, NJ

E N D
Variability in surface ozone background over the United States: Implications for air quality policy Arlene Fiore1, Daniel J. Jacob, Hongyu Liu2, Robert M. Yantosca, T. Duncan Fairlie2, and Qinbin Li 1Now at Princeton/GFDL, Princeton, NJ 2Now at National Institute of Aerospace, Hampton, VA ACCESS VII Program September 5, 2003 EPA O3 air quality standard: 4th highest daily maximum 8-hour average O3 concentration must be ≤ 84 ppbv (3-year avg)
“REGULATORY BACKGROUND” DEFINITION: O3 concentrations that would exist in the absence of anthrop. emissions from N. Amer. [EPA, 2003] i.e., background includes: Natural O3 from the stratosphere or produced from natural precursor emissions anywhere; Anthropogenic O3 produced from precursor emissions outside N. America Need to quantify U.S. surface background O3 for current review of O3 standard Range of background O3 estimates in U.S. surface air Range considered by EPA during last revision of O3 standard 84 ppbv: threshold for current U.S. O3 standard 20 40 60 80 100 Used by EPA to assess health risk from O3 O3 (ppbv) Frequent obs. attributed to natural background [Lefohn et al. 2001] Range from prior global modeling studies What are appropriate background concentration(s) for assessing risk from O3? Is the standard set too close to background levels?
TOOL:GEOS-CHEM 3D Tropospheric Chemistry Model [Bey et al., 2001] (uses assim. met.; 48 s; 4ºx5º or 2ºx2.5º horiz. resn., 24 tracers) Sensitivity Simulations for source attribution Mar-Oct 2001 • Standard simulation…..2x2.5 GEOS-CHEM, 48 sigma levels 2001 • Background………………no anthrop. NOx, CO, NMVOC emissions from N. America • Natural O3 level………….no anthrop. NOx, CO, NMVOC emissions globally; CH4 = 700 ppbv • Stratospheric…………….tagged O3 tracer simulation Regional Pollution = Standard – Background Hemispheric Pollution = Background – Natural O3 level Use 2001 CASTNet data in conjunction with GEOS-CHEM to investigate how background O3 varies with season and region diagnose origin of springtime high-O3 events at remote U.S. sites
* CASTNet sites Model at CASTNet Model entire region Background Natural O3 level Stratospheric + Monthly mean afternoon (1-5 p.m.) surface O3 { { Regional pollution from N. Am. emis. (8-30 ppbv) Hemispheric pollution enhancement (5-12 ppbv) { { Mean background: 20-35 ppbv Mean natural level: 13-27 ppbv Mean stratosphere: 2-7 ppbv Mar-Oct 2001 U.S. daily mean afternoon surface O3 Probability ppbv-1 Background < 50 ppbv Natural level < 40 ppbv Stratosphere < 20 ppbv
* CASTNet sites Model Background Natural O3 level Stratospheric Continental lower troposphere + APR-MAY 2000 High-O3 “Haywood County” event in North Carolina APR-MAY 2001 Isentropic back-trajectory with the GEOS met fields } Regional pollution D = capture previously reported strong subsidence (http://www.asl-associates.com/ ncreport.htm) } D = Hemispheric pollution Originates in free-troposphere Model explains this event by regional pollution rather than a large stratospheric influence
* CASTNet sites Model Background Natural O3 level Stratospheric Continental lower troposphere + } Regional pollution D = Case study: Time series at Yellowstone NP, WY; frequent high-O3 events previously attributed to natural, stratospheric source [Lefohn et al., 2001] } D = Hemispheric pollution Yellowstone NP, Wyoming March-May 2001 High-altitude site should receive free-tropospheric O3 more frequently; Not necessarily representative of background contribution at surface sites
* CASTNet sites Model Background Natural O3 level Stratospheric + West (>1.5 km) Southeast (<1.5 km) Background O3 higher at elevated western sites Ozone (ppbv) Background decreases with highest observed O3 at SE sites Days in March 2001
* CASTNet sites Model Background Natural O3 level Stratospheric + Background O3 for risk assessment =f (season, altitude, total O3 concentration) Enhancement from N. Amer & hemis. pollution for high O3 concentrations Lower background; larger pollution influence in summer (& fall) 12 elevated sites; all in west Regional Pollution 58 surface sites Cumulative Probability (daily mean afternoon O3) Using average background for pollution episodes underestimates risk to human health! Lower background at surface sites; Maximum contribution at the center of the O3 distribution
CONCLUSIONS ...and their implications for policy • 1. Background O3 varies with season, site elevation, and total surface O3 concentrations • -- highest at high-altitude western U.S. sites in spring • -- lower at surface sites and in summer • -- depleted during polluted conditions • health risk from O3 underestimated in present EPA risk assessments • High-O3 events at remote U.S. sites in spring previously attributed to a natural stratospheric source can be explained largely by regional pollution • these events should not be used to challenge legitimacy of O3 NAAQS; measurements at these sites are not representative of background • Hemispheric pollution enhances U.S. background • international agreements to reduce hemispheric background would improve U.S. air quality & facilitate compliance w/ more stringent standards
Health and Environmental Risk Excess risk associated with observed O3 concentration above background total risk from observed O3 Quantitative definition of background is criticalfor use in risk assessment risk from background O3 40 observed Ozone (ppbv)