Probability Rules
Probability Rules. Money. Pull a bill from your wallet or pocket without looking at it. An outcome of this trial is the bill you select. The sample space is all the bills in circulation: S = {$1 bill, $2 bill, $5 bill, $10 bill, $20 bill, $50 bill, $100 bill}


Probability Rules
E N D
Presentation Transcript
Money • Pull a bill from your wallet or pocket without looking at it. • An outcome of this trial is the bill you select. The sample space is all the bills in circulation: • S = {$1 bill, $2 bill, $5 bill, $10 bill, $20 bill, $50 bill, $100 bill} • These are all possible outcomes
Money • S = {$1 bill, $2 bill, $5 bill, $10 bill, $20 bill, $50 bill, $100 bill} • We can combine the outcomes in different ways to make many different events. • For example, event A = {$1, $5, $10} represents selecting a $1, a $5, or a $10 bill • The event B = {a bill that does not have a president on it} is the collection of outcomes (Don’t look, can you name them?): • B = {$10 (Hamilton), $100 (Franklin)} • The event C = {enough money to pay for a $12 meal with one bill} is the set of outcomes {$20, $50, $100}
Money • Notice that the outcomes are not equally likely. • You would no doubt be more surprised (and more pleased) to pull out a $100 bill rather than a $1 bill. It isn’t very likely, though. • The probability of event C is not 3/7, because although there are 7 possible outcomes and 3 of them exceed 12$, they are not equally likely.
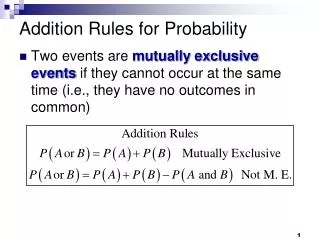
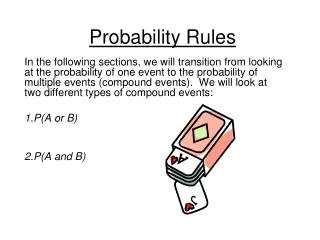
The General Addition Rule • With those bills: There are images of famous buildings in the center of the backs of all but two bills in circulation. The 1$ bill has the word ONE in the center and the $2 bill shows the signing of the Declaration of Independence • What is the probability of randomly selecting A = {a bill with an odd numbered value} • Or • B = {a bill with a building on the reverse}? • A = {$1, $5}B = {$5, $10, $20, $50, $100}
The General Addition Rule • A = {$1, $5}B = {$5, $10, $20, $50, $100} • But P(A or B) is not simply the sum P(A) + P(B) because the events A and B are not disjoint – 5$ is in both sets. • We need a new addition rule.
The General Addition Rule • The 5$ bill plays a big role because it is counted twice, it is both odd and has a building on the reverse. We cannot add the probabilities because we would count the 5 twice. • We can compensate by subtracting out the probability of that 5$ bill. • P(odd number value or building) =P(odd number value) + P(building) – P(odd number value and building)= P($1, $5) + P($5, $10, $20, $50, $100) – P($5)
The General Addition Rule • This rule does not require disjoint events.
The General Addition Rule • A survey of college students found that 56% live in a campus residence hall, 62% participate in a campus meal program, and 42% do both. • What is the probability that a randomly select student either lives or eats on campus? • Let L = {student lives on campus} • Let M = {Campus meal plan}
General Addition Rule Example • There is a 76% chance that a randomly selected college student either lives or eats on campus.
General Addition Rule Example Continued • 56% of students live on campus • 62% have a meal plan • 42% do both • Question: Based on a Venn Diagram, what is the probability that a randomly selected student:- Lives off campus but doesn’t have a meal plan?- Lives in a residence hall but doesn’t have a meal program? L = 0.14 M = 0.20 0.42
Venn Diagram Example • The intersection of the circles is • Since • Also, • Now, 0.14 + 0.42 + 0.20 = 0.76, leaving 1-0.76 = 0.24 for the region outside both circles. L = 0.14 M = 0.20 0.42 0.24
Now, L = 0.14 M = 0.20 0.42 0.24
Just Checking • In chapter 1 your book suggested that you sample some pages at random and see whether they held a graph or other data display. Here are the results after taking a representative sample: • 48% of pages had some kind of data display • 27% of pages had an equation • 7% of pages had both a data display and an equation. • Display these results with a Venn Diagram. Equation0.20 Drawing0.41 Both0.07 0.32
Just Checking • What is the probability that a randomly selected sample page had neither a data display nor an equation? • What is the probability that a randomly selected sample page had a data display but no equation? Equation0.20 Drawing0.41 Both0.07 0.32
Another Example! • Police report that 78% of drivers stopped on suspicion of drunk driving are given a breath test, 36% a blood test, and 22% both tests. • What is the probability that a randomly selected DWI suspect is given:a) a test?b) a blood test or a breath test but not both?c) neither test? • Let A = {suspect is given a breath test} • Let B = {suspect is given a blood test} • We know that P(A) = 0.78 P(B) = 0.36 • Time to make a picture!
DWI Tests • Let A = {suspect is given a breath test} • Let B = {suspect is given a blood test} • We know that P(A) = 0.78 P(B) = 0.36 A0.56 B0.14 0.22 0.08
DWI Tests • What is the probability that a suspect is given a test? • The probability a suspect is given a test is We can use the General Addition Rule, or we can add the probabilities from the diagram. • Or 0.14 0.56 0.22 0.08
DWI Question 2 • What is the probability that a suspect gets either a blood test or a breath test but NOT both? • We can use the rule or just add the appropriate probabilities found in the Venn Diagram • OR • P(A or B but NOT both) = 0.14 0.56 0.22 0.08
DWI Question 3 • What is the probability that the suspect gets neither test? • Getting neither test is the complement of getting one or the other. Use the Complement Rule or just notice “neither test” is represented by the region outside both circles. • OR 0.14 0.56 0.22 0.08
It Depends… • Two psychologists surveyed 478 children in grades 4, 5, and 6 in elementary schools in Michigan. They stratified their sample, drawing roughly 1/3 from rural, 1/3 from suburban, and 1/3 from urban schools. • Among the questions they asked the students whether their primary goal was to get good grades, to be popular, or to be good at sports.
It Depends… • We looked at contingency tables and graphed conditional distributions back in Chapter 3 • Here are some pie charts that show the relative frequencies with which boys and girls named the three goals. • From here it is only a short step to probabilities.
It Depends… • Let us focus on this study and make the sample space just these 478 students. If we select a student at random from this study the probability we select a girl is just the corresponding relative frequency (since we are equally likely to select any of the 478 students) • There are 251 girls in the data out of a total of 478 • P(girl) = 251/478 = 0.525 • The same method works for more complicated events like intersections. For example, what is the probability of selecting a girl whose goal is to be popular? • Well, 91 girls named popularity as their goal, so
It Depends • The probability of selecting a student whose goal is to excel at sports is: • P(sports) = 90/478 = 0.188 • What if we are given the information that the selected student is a girl? • Would that change the probability that the selected student’s goal is sports?
It Depends • The pie chart shows that girls are much less likely to say their goal is to excel at sports than boys are. • When we restrict our focus to girls, we look only at the girls’ row of the table. • Of the 251 girls only 30 of them said their goal was to excel at sports. • We write the probability that a selected student wants to excel at sports giventhat we have selected a girl as
It Depends • For boys, we look at the conditional distribution of goals given “boy” shown in the top row of the table. There, of 227 boys, 60 said their goal was to excel at sports. • This is more than twice the girls’ probability
Conditional Probability • In general, when we want the probability of an event from a conditional distribution, we write and pronounce it “the probability of Bgiven A. • A probability that takes into account a given condition such as this is called a conditional probability.
Conditional Probability • What We Did: • We worked with counts but it works with probabilities just as well. There were 30 students who both were girls and had sports as their goal, and there are 251 girls. • We found the probability to be 30/251 • To find the probability of Bgiven event A, we restrict our attention to the outcomes in A. We find in what fraction of those outcomes B also occurred. • Formally we write,
Conditional Probability • This is just what we did but now with probabilities instead of counts.
Conditional Probability • What is the probability that we have selected a girl given that the selected student’s goal is popularity? • We apply our rule:
Example • Our survey found that 56% of college students live on campus, 62% have a campus meal program, and 42% do both. • While dining in a campus facility open only to students with meal plans, you meet someone interesting. What is the probability that your new acquaintance lives on campus? • Let L = {student lives on campus} • Let M = {student has a campus meal plan} • P(student lives on campus given that the student has a meal plan) = • There is approximately a 67.7% chance that a student with a meal plan lives on campus.
The General Multiplication Rule • The Multiplication Rule for the probability of A and B: • Now we can write a more general rule that doesn’t require independence. In fact, we already have written it, we just need to rearrange it. • This is the General Multiplication Rule for compound events that does not require the events to be independent.
General Multiplication Rule • The rule makes sense, the probability that two events A and B, both occur is the probability that event A occurs multiplied by the probability that event Balso occurs. • Of course, there is nothing special about which set we call A and which one we call B.
Independence • If you had to pick one idea in this chapter to understand and remember, it is the definition and meaning of independence. We will need this idea in every one of the chapters to follow. • We said informally that what we mean by independence is that the outcome of one event does not influence the probability of the other. • With our new notation for conditional probabilities we can write a formal definition: • Events A and B are independent whenever:
Independence • We can see that the Multiplication Rule for independent events is just a special case of the General Multiplication Rule. • The General Rule: Whether the events are independent or not. • When events A and B are independent we can write in place of • That gets us back to our simpler rule, • Sometimes this statement is used as the definition of independent events but the other one may feel more intuitive.
Independence • Is the probability of having good grades as a goal independent of the sex of the respecting student? • We need to check whether • To two decimal place accuracy, it looks like we can consider choosing good grades as a goal to be independent of sex.
Example • Our survey told us that 56% of college students live on campus, 62% have a meal program, and 42% do both. • Are living on campus and having a meal plan independent? Are they disjoint? • Let L={Student Living on Campus} • Let M={student has a campus meal plan} • If these events are independent, then knowing that a student lives on campus doesn’t affect the probability that he or she has a meal plan. • Check to see if
Example • But • Therefore, because the events are not independent; students who live on campus are more likely to have meal plans. Living on campus and having a meal plan are not disjoint either; in fact, 42% of college students do both.
Independent Disjoint • Are disjoint events independent? • In fact disjoint events cannot be independent • Consider the two disjoint events {you get an A in the course} and {you get a B in the course} • They are disjoint because they have no outcomes in common. • Suppose you learn that you did get an A in the course. Now what is the probability that you got a B? • You can’t get both grades, so it must be 0.
Independent Disjoint • Knowing that the first event (getting an A) occurred changed your probability for the second event. • SO the events are not independent. • Mutually exclusive events cannot be independent. They have no outcomes in common, so if one occurs, the other doesn’t. B A
Just Checking • The American Association for Public Opinion Research (AAPOR) is an association of about 1600 individuals who share an interest in public opinion and survey research. They report that typically as few as 10% of random phone calls result in a completed interview. Reasons are varied, but some of the most common include no answer, refusal to cooperate, and failure to complete the call. • Which of the following events are independent, which are disjoint, and which are neither independent nor disjoint? • 1) A={Your telephone number is randomly selected} B={You’re not at home at dinnertime when they call} • Independent
Just Checking • 2) A={As a selected subject, you complete the interview} B={As a selected subject, you refuse to cooperate} • Disjoint • 3) A={You are not at home when they call at 11am B={You are employed full time} • Neither
Depending on Independence • Take careful note about how you treat independent and dependent events and how you find them. • Often there is a lot more dependence going on than you might expect. • Experts assured us that the probability of a major commercial nuclear power plant failure is so small that we should not expect such a failure to occur even in a span of hundreds of years.
Depending on Independence • We have seen three significant failures of nuclear power plants! • Chernobyl • Three Mile Island • And Fukushima Daiichi
Depending on Independence • A simple part of the failure calculation is to test a particular valve and determine that valves such as this one fail only once in say, 100 years • For a coolant failure to occur several valves must fail. • So we need the compound probability, P(valve 1 fails and valve 2 fails and …) • A simple risk assessment might multiply the small probability of one valve failure together as many times as needed. • But if the valves all came from the same manufacturer, a flaw in one might be found in others. • Maybe when the first fails it puts additional pressure on the next in line. • In either case, the events are not independent so we can’t just multiply the probabilities together.
Tables and Conditional Probability • One of the easiest ways to think about conditional probabilities is with contingency tables • We can often construct a simple table to correspond to the probabilities • For Example, • In the drunk driving example we were told that 78% of suspect drivers get a breath test, 36% a blood test, and 22% both
Drunk Driving Example • Notice that 0.78 and 0.36 are marginal probabilities and so they go into the margins • The 0.22 probability of getting both tests – a breath test and a blood test – so that’s a join probability • Because the cells of the table show disjoint events, the probabilities always add up to the marginal totals going across rows or down columns. So, filling in the rest of the table is quick:
Conditional Probability • Compare with the Venn Diagram, notice which entries in the table match up with the sets in the diagram. • Whether a Venn Diagram or a table is better to use will depend on what you are given and the questions you are being asked. • Try both.
Another Example • Police report 78% of drivers are given a breath test, 36% a blood test, and 22% both • 1) Are giving a DWI suspect a blood test and a breath test mutually exclusive? • Let A = {suspect is given a breath test} • Let B = {suspect is given a blood test} • Disjoint events cannot both happen at the same time, so check to see if 0 • Because we know that it does not, these events are not mutually exclusive
Another Example (CONT) • Are the two tests independent? • Let’s make a table! • So, does • Because the probabilities are not the same the events are not independent.