Profit Margin (PM)
NI Sales. $253.6 $7,036. PM = = = 3.6%. Profit Margin (PM). 2005E 2004 2003 Ind. PM 3.6% -1.6% 2.6% 3.6%. Very bad in 2004, but projected to meet industry average in 2005. Looking good. Basic Earning Power (BEP). EBIT Total assets. BEP =

Profit Margin (PM)
E N D
Presentation Transcript
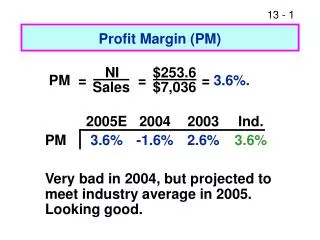
NI Sales $253.6 $7,036 PM = = = 3.6%. Profit Margin (PM) 2005E 2004 2003 Ind. PM 3.6% -1.6% 2.6%3.6% Very bad in 2004, but projected to meet industry average in 2005. Looking good.
Basic Earning Power (BEP) EBIT Total assets BEP = = = 14.3%. $502.6 $3,517 (More…)
2005E 2004 2003 Ind. BEP 14.3% 0.6% 14.2%17.8% • BEP removes effect of taxes and financial leverage. Useful for comparison. • Projected to be below average. • Room for improvement.
Return on Assets (ROA) and Return on Equity (ROE) Net income Total assets ROA = = = 7.2%. $253.6 $3,517 (More…)
Net income Common equity ROE = = = 12.8%. $253.6 $1,977 2005E 2004 2003 Ind. ROA 7.2% -3.3% 6.0%9.0% ROE 12.8% -17.1% 13.3%18.0% Both below average but improving.
Effects of Debt on ROA and ROE • ROA is lowered by debt--interest expense lowers net income, which also lowers ROA. • However, the use of debt lowers equity, and if equity is lowered more than net income, ROE would increase.
Price = $12.17. EPS = = = $1.01. P/E = = = 12x. NI Shares out. $253.6 250 Price per share EPS $12.17 $1.01 Calculate and appraise the P/E, P/CF, and M/B ratios.
Industry P/E Ratios IndustryTicker*P/E Banking STI 17.6 Software MSFT 33.0 Drug PFE 31.7 Electric Utilities DUK 13.7 Semiconductors INTC 57.5 Steel NUE 28.1 Tobacco MO 12.3 Water Utilities CFT 21.8 S&P 500 30.4 *Ticker is for typical firm in industry, but P/E ratio is for the industry, not the individual firm.
NI + Depr. Shares out. CF per share = = = $1.49. $253.6 + $120.0 250 Price per share Cash flow per share P/CF = = = 8.2x. $12.17 $1.49
Com. equity Shares out. BVPS = = = $7.91. $1,977 250 Mkt. price per share Book value per share M/B = = = 1.54x. $12.17 $7.91