Download
1 / 42
420 likes | 614 Vues
Chapter 6. BA 315 @UMSL Cost-Volume-Profit (Contribution Margin) Relationships. The Basics of Cost-Volume-Profit (CVP) Analysis. Contribution Margin (CM) is the amount remaining from sales revenue after variable expenses have been deducted. The Basics of Cost-Volume-Profit (CVP) Analysis.

E N D
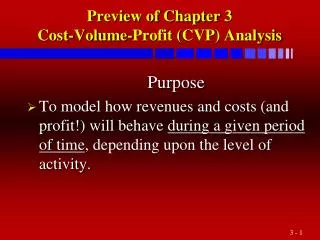
Chapter6 BA 315 @UMSL Cost-Volume-Profit (Contribution Margin) Relationships
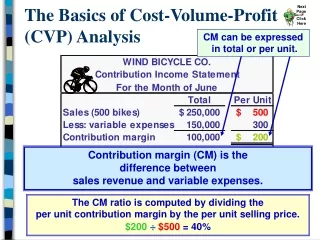
The Basics of Cost-Volume-Profit (CVP) Analysis Contribution Margin (CM) is the amount remaining from sales revenue after variable expenses have been deducted.
The Basics of Cost-Volume-Profit (CVP) Analysis CM goes to cover fixed expenses.
The Basics of Cost-Volume-Profit (CVP) Analysis After covering fixed costs, any remaining CM contributes to income.
The Contribution Approach For each additional unit Wind sells, $200 more in contribution margin will help to cover fixed expenses and profit.
The Contribution Approach Each month Wind must generate at least $80,000 in total CM to break even.
The Contribution Approach If Wind sells 400 unitsin a month, it will be operating at the break-even point.
The Contribution Approach If Wind sells one additional unit (401 bikes), net income will increase by $200.
The Contribution Approach The break-even point can be defined either as: • The point where total sales revenue equals total expenses (variable and fixed). • The point where total contribution margin equals total fixed expenses.
Contribution margin Sales CM Ratio = $200 $500 = 40% Contribution Margin Ratio The contribution margin ratio is:For Wind Bicycle Co. the ratio is:
Contribution Margin Ratio At Wind, each $1.00 increase in sales revenue results in a total contribution margin increase of 40¢. If sales increase by $50,000, what will be the increase in total contribution margin?
Contribution Margin Ratio A $50,000 increase in sales revenue
Contribution Margin Ratio A $50,000 increase in sales revenue results in a $20,000 increase in CM. ($50,000 × 40% = $20,000)
Changes in Fixed Costs and Sales Volume Wind is currently selling 500 bikes per month. The company’s sales manager believes that an increase of $10,000 in the monthly advertising budget would increase bike sales to 540 units. • Should we authorize the requested increase in the advertising budget?
Changes in Fixed Costs and Sales Volume $80,000 + $10,000 advertising = $90,000 Sales increased by $20,000, but net income decreased by $2,000.
Changes in Fixed Costs and Sales Volume The Shortcut Solution
Break-Even Analysis Break-even analysis can be approached in two ways: • Equation method • Contribution margin method.
Equation Method Profits = Sales – (Variable expenses + Fixed expenses) OR Sales = Variable expenses + Fixed expenses + Profits At the break-even point profits equal zero.
Equation Method Here is the information from Wind Bicycle Co.:
Equation Method • We calculate the break-even point as follows: Sales = Variable expenses + Fixed expenses + Profits $500Q = $300Q + $80,000 + $0 Where: Q = Number of bikes sold $500 = Unit sales price $300 = Unit variable expenses $80,000 = Total fixed expenses
Equation Method • We calculate the break-even point as follows: Sales = Variable expenses + Fixed expenses + Profits $500Q = $300Q + $80,000 + $0 $200Q = $80,000 Q = 400 bikes
Equation Method • We can also use the following equation to compute the break-even point in sales dollars. Sales = Variable expenses + Fixed expenses + Profits X = 0.60X + $80,000 + $0 Where: X = Total sales dollars 0.60 = Variable expenses as a percentage of sales $80,000 = Total fixed expenses
Equation Method • We can also use the following equation to compute the break-even point in sales dollars. Sales = Variable expenses + Fixed expenses + Profits X = 0.60X + $80,000 + $0 0.40X = $80,000 X = $200,000
Break-even point in units sold Fixed expenses Unit contribution margin = Break-even point in total sales dollars Fixed expenses CM ratio = Contribution Margin Method The contribution margin method is a variation of the equation method.
CVP Relationships in Graphic Form Viewing CVP relationships in a graph gives managers a perspective that can be obtained in no other way. Consider the following information for Wind Co.:
CVP Graph Total Expenses Dollars Fixed expenses Units
CVP Graph Total Sales Dollars Units
CVP Graph Profit Area Dollars Break-even point Loss Area Units
Target Profit Analysis Suppose Wind Co. wants to know how many bikes must be sold to earn a profit of $100,000. We can use our CVP formula to determine the sales volume needed to achieve a target net profit figure.
The CVP Equation Sales = Variable expenses + Fixed expenses + Profits $500Q = $300Q + $80,000 + $100,000 $200Q = $180,000 Q = 900 bikes
Units sold to attain the target profit Fixed expenses + Target profit Unit contribution margin = $80,000 + $100,000 $200 = 900 bikes The Contribution Margin Approach We can determine the number of bikes that must be sold to earn a profit of $100,000 using the contribution margin approach.
The Margin of Safety Excess of budgeted (or actual) sales over the break-even volume of sales. The amount by which sales can drop before losses begin to be incurred. Margin of safety = Total sales - Break-even sales Let’s calculate the margin of safety for Wind.
The Margin of Safety Wind has a break-even point of $200,000. If actual sales are $250,000, the margin of safety is $50,000 or 100 bikes.
The Margin of Safety The margin of safety can be expressed as 20 percentof sales.($50,000 ÷ $250,000)
Degree of operating leverage Contribution margin Net income = Operating Leverage • A measure of how sensitive net income is to percentage changes in sales. • With high leverage, a small percentage increase in sales can produce a much larger percentage increase in net income.
$100,000 $20,000 = 5 Operating Leverage
Operating Leverage With a measure of operating leverage of 5, if Wind increases its sales by 10%, net income would increase by 50%. Here’s the proof!
Operating Leverage 10% increase in sales from $250,000 to $275,000 . . . . . . results in a 50% increase in income from $20,000 to $30,000.
The Concept of Sales Mix • Sales mix is the relative proportions in which a company’s products are sold. • Different products have different selling prices, cost structures, and contribution margins. Let’s assume Wind sells bikes and carts and see how we deal with break-even analysis.
The Concept of Sales Mix Wind Bicycle Co. provides us with the following information: $265,000 $550,000 = 48% (rounded) $170,000 0.48 = $354,167 (rounded)
Assumptions of CVP Analysis • Selling price is constant throughout the entire relevant range. • Costs are linear throughout the entire relevant range. • In multi-product companies, the sales mix is constant. • In manufacturing companies, inventories do not change (units produced = units sold).
We made It, say’s LPC! Second Ending of Chapter 6-BA 315Now , BFV 10, Fuzz Fresh & Lavaca