Download
1 / 16
170 likes | 337 Vues
Rasio profitabilitas terdiri dari dua jenis rasio yang menunjukkan laba dalam hubungannya dengan : penjualan investasi. Jenis - jenis rasio Profitabilitas ( menurut Munawir ):. Profit margin (profit margin on sales) Hasil Pengembalian Investasi (Return on investment )

E N D
Rasioprofitabilitasterdiridariduajenisrasio yang menunjukkanlabadalamhubungannyadengan: penjualan investasi.
Jenis- jenisrasioProfitabilitas (menurutMunawir): • Profit margin (profit margin on sales) • HasilPengembalianInvestasi (Return on investment) • HasilPengembalianEkuitas (Return on Equity/ROE) • rentabilitas ekonomi • Laba Per LembarSahamBiasa (Earning per Share of Common Stock)
Gross Profit Sales Gross Profit Margin = Profit Margin 1. Gross Profit Margin X 100% Seberapa efektif perusahaan dalam menghasilkan laba kotor dari setiap rupiah penjualannya?
Gross Profit = Margin Gross Profit Sales 575_ 1,450 Gross Profit Margin = = 39.7% Neraca LMT Trustco Cash 175 Accounts Payable 115 Accounts Receivable 430 S-T Notes Payable 115 Inventories 625Current Liabilities 230 Current Assets 1,230 Bonds 600 Plant & Equipment 2,500 Owner’s Equity Less:Acc. Depr. (1,200) Common Stock 300 Net Fixed Assets 1,300 Capital in Excess of Par 600 Total Assets 2,530 Retained Earnings 800 Total Owners’ Equity 1,700 Total Liabilities and Owners Equity 2,530 Ilustrasi : Laporan Laba/Rugi LMT Trustco Sales 1,450 Cost of Goods Sold 875 Gross Profit 575 Operating Expenses 45 Depreciation 200 Net Operating Income 330 Interest Expense 60 Income Before Taxes 270 Taxes (40%) 108 Net Income 162 Common Dividends Paid 100 Addition to Retained Earnings 62 X 100%
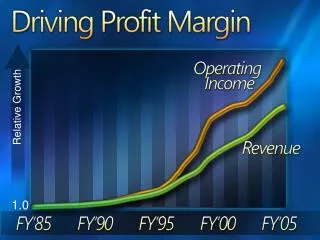
Operating Income Sales Operating Profit Margin = 2. Operating Profit Margin X 100% Seberapa efektif perusahaan dalam menghasilkan laba operasi dari setiap rupiah penjualannya?
Operating Profit = Margin Operating Income X 100% Sales 330_ 1,450 OPM = = 22.8% Neraca LMT Trustco Ilustrasi : Cash 175 Accounts Payable 115 Accounts Receivable 430 S-T Notes Payable 115 Inventories 625 Current Liabilities 230 Current Assets 1,230 Long-term Debt 600 Plant & Equipment 2,500 Owner’s Equity Less:Acc. Depr. (1,200) Common Stock 300 Net Fixed Assets 1,300 Capital in Excess of Par 600 Total Assets 2,530 Retained Earnings 800 Total Owners’ Equity 1,700 Total Liabilities and Owners Equity 2,530 Laporan Laba/Rugi LMT Trustco Sales 1,450 Cost of Goods Sold 875 Gross Profit 575 Operating Expenses 45 Depreciation 200 Operating Income 330 Interest Expense 60 Income Before Taxes 270 Taxes (40%) 108 Net Income 162 Common Dividends Paid 100 Addition to Retained Earnings 62
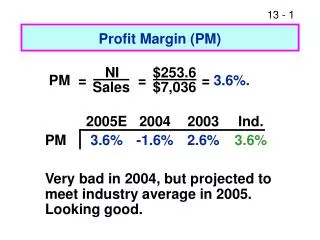
Net Income Sales Net Profit Margin = 3. Net Profit Margin X 100% Seberapa besar laba bersih yang dihasilkan dari setiap rupiah penjualannya?
Net Profit = Margin Net Income Sales 162_ 1,450 Net Profit Margin = = 11.2% Neraca LMT Trustco Ilustrasi : Assets Liabilities Cash 175 Accounts Payable 115 Accounts Receivable 430 S-T Notes Payable 115 Inventories 625 Current Liabilities 230 Current Assets 1,230 Long-term Debt 600 Plant & Equipment 2,500 Owner’s Equity Less:Acc. Depr. (1,200) Common Stock 300 Net Fixed Assets 1,300 Capital in Excess of Par 600 Total Assets 2,530 Retained Earnings 800 Total Owners’ Equity 1,700 Total Liabilities and Owners Equity 2,530 Laporan Laba/Rugi LMT Trustco Sales 1,450 Cost of Goods Sold 875 Gross Profit 575 Operating Expenses 45 Depreciation 200 Operating Income 330 Interest Expense 60 Income Before Taxes 270 Taxes (40%) 108 Net Income 162 Common Dividends Paid 100 Addition to Retained Earnings 62 X 100%
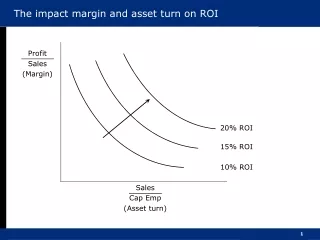
Net Income Total investasi(asset) ROI = Return on investment X 100% Seberapa efektif perusahaan menghasilkan laba bersih dari aktiva yang digunakannya?
Net Income Total Assets = ROI 162_ 2,530 = 6.4% ROA = Neraca LMT Trustco Assets Liabilities Cash 175 Accounts Payable 115 Accounts Receivable 430 S-T Notes Payable 115 Inventories 625 Current Liabilities 230 Current Assets 1,230 Long-term debt 600 Plant & Equipment 2,500 Owner’s Equity Less:Acc. Depr. (1,200) Common Stock 300 Net Fixed Assets 1,300 Capital in Excess of Par 600 Total Assets 2,530 Retained Earnings 800 Total Owners’ Equity 1,700 Total Liabilities and Owners Equity 2,530 Ilustrasi : Laporan Laba/Rugi LMT Trustco Sales 1,450 Cost of Goods Sold 875 Gross Profit 575 Operating Expenses 45 Depreciation 200 Operating Income 330 Interest Expense 60 Income Before Taxes 270 Taxes (40) 108 Net Income% 162 Common Dividends Paid 100 Addition to Retained Earnings 62 X 100%
Net Income Common Equity Return on Equity = Return on Equity X 100% Seberapa baik perusahaan menghasilkan laba bersih untuk pemegang ekuitas?
Net Income Common Equity ROE= 162_ 1,700 ROE = = 9.53% Neraca LMT Trustco Assets Liabilities Cash 175 Accounts Payable 115 Accounts Receivable 430 S-T Notes Payable 115 Inventories 625 Current Liabilities 230 Current Assets 1,230 Long-term Debt 600 Plant & Equipment 2,500 Owner’s Equity Less:Acc. Depr. (1,200) Common Stock 300 Net Fixed Assets 1,300 Capital in Excess of Par 600 Total Assets 2,530 Retained Earnings 800 Total Owners’ Equity 1,700 Total Liabilities and Owners Equity 2,530 Ilustrasi : Laporan Laba/Rugi LMT Trustco Sales 1,450 Cost of Goods Sold 875 Gross Profit 575 Operating Expenses 45 Depreciation 200 Operating Income 330 Interest Expense 60 Income Before Taxes 270 Taxes (40%) 108 Net Income 162 Common Dividends Paid 100 Addition to Retained Earnings 62 X 100%
EBIT Total aktiva RE = X 100% Seberapa efektif perusahaan menghasilkan laba bersih dari aktiva yang digunakannya? RentabilitasEkonomi
EBIT Total Assets = RE 330_ 2,530 = 13,04% RE = Neraca LMT Trustco Assets Liabilities Cash 175 Accounts Payable 115 Accounts Receivable 430 S-T Notes Payable 115 Inventories 625 Current Liabilities 230 Current Assets 1,230 Long-term debt 600 Plant & Equipment 2,500 Owner’s Equity Less:Acc. Depr. (1,200) Common Stock 300 Net Fixed Assets 1,300 Capital in Excess of Par 600 Total Assets 2,530 Retained Earnings 800 Total Owners’ Equity 1,700 Total Liabilities and Owners Equity 2,530 Ilustrasi : Laporan Laba/Rugi LMT Trustco Sales 1,450 Cost of Goods Sold 875 Gross Profit 575 Operating Expenses 45 Depreciation 200 Operating Income 330 Interest Expense 60 Income Before Taxes 270 Taxes (40) 108 Net Income% 162 Common Dividends Paid 100 Addition to Retained Earnings 62 X 100%
Rasio Nilai Pasar (Market value ratios)Earning Per share /EPS Laba Bersih EPS = --------------------------- x 1 rupiah Jumlah Lembar saham beredar __________________________________________ __________________________________________
Laba Bersih Lbr Saham Rp. 162 100 lbr Rp.1,62 EPS(Laba /lbr saham) EPS = EPS = Neraca LMT Trustco Assets Liabilities Cash 175 Accounts Payable 115 Accounts Receivable 430 S-T Notes Payable 115 Inventories 625 Current Liabilities 230 Current Assets 1,230 Long-term Debt 600 Plant & Equipment 2,500 Owner’s Equity Less:Acc. Depr. (1,200) Common Stock 300 Net Fixed Assets 1,300 Capital in Excess of Par 600 Total Assets 2,530 Retained Earnings 800 Total Owners’ Equity 1,700 Total Liabilities and Owners Equity 2,530 Laporan Laba/Rugi LMT Trustco Sales 1,450 Cost of Goods Sold 875 Gross Profit 575 Operating Expenses 45 Depreciation 200 Operating Income 330 Interest Expense 60 Income Before Taxes 270 Taxes (40) 108 Net Income 162 Common Dividends Paid 100 Addition to Retained Earnings 62