Download
1 / 10
100 likes | 169 Vues
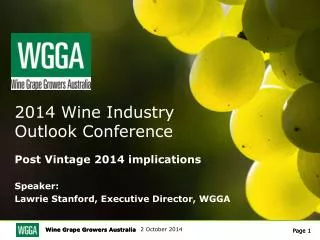
Join us at the Economic and Social Outlook Conference 2014 hosted by the Energy Supply Association of Australia on 3 July 2014. This event will explore the challenges and opportunities in Australia's energy landscape. Learn about the peaks in various sectors like newspaper sales, landline usage, car ownership, electricity consumption, and retail market trends. Discover how sustainability, affordability, and reliability play crucial roles in shaping the energy future. We will delve into the National Electricity Market (NEM) demand from 2000-2014 and discuss energy and climate policies, tariffs, markets, and climate forecasts. The conference will feature insights from industry experts and policymakers. Don't miss this valuable opportunity to gain a comprehensive understanding of Australia's energy dynamics.

E N D
Economic and Social Outlook Conference 2014 Energy Supply Association of Australia 03 July 2014
Hitting the peak in Australia Peak newspaper – 1990 Peak landline – 2003 Peak car - 2004 Peak electricity – 2008 Peak retail - 2010
The energy triangle of pain Sustainability Affordability Reliability
Energy and climate policy are the same Tariffs Markets Climate Forecasts