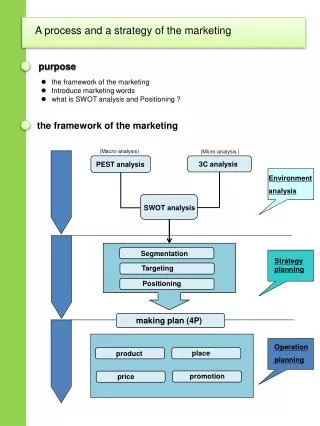
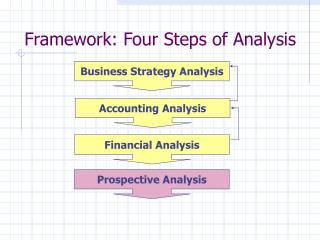
Framework: Four Steps of Analysis
Framework: Four Steps of Analysis. Business Strategy Analysis. Accounting Analysis. Financial Analysis. Prospective Analysis. Why Forecast?. Two users: Internal users Managerial planning External users Financial analysts Merger and acquisition Security analysis

Framework: Four Steps of Analysis
E N D
Presentation Transcript
Framework: Four Steps of Analysis Business Strategy Analysis Accounting Analysis Financial Analysis Prospective Analysis
Why Forecast? • Two users: • Internal users • Managerial planning • External users • Financial analysts • Merger and acquisition • Security analysis • Credit and bankruptcy analysis • Two tasks in prospective analysis • Forecasting • Valuation
Relation to Other Analyses • Summarize the findings from analysis of business strategy, accounting, and financing • Business Strategy Analysis • What does industry analysis indicate about future trends? • What is the company’s plan to respond to those trends? • Accounting Analysis • How does past accounting reporting imply about future accounting statements? • Will accounting reflect the expected future trends? • Financial Analysis • What can be improved? • What will be under pressure from competition? From government regulation? • What are management’s target areas for change?
General Approach • Comprehensive vs. Piecemeal • Comprehensive avoids internal inconsistencies and unrealistic assumptions • Examples • Increasing sales without supporting plant and working capital need • Increasing new financing without additional interest • Focus on key “drivers” • Sales (grow prospect) • Revenue and Expenses (profitability) • Asset turnover (efficiency) Affect all the other financial statement items
Starting Points • Gather historical data about the firm and its industry • What relationships appear stable? • past is surprisingly good predictor of the future • Business Strategy Analysis provides insights into what changes are likely to occur • why would things be different from last year? • One-time events? Change in strategy? Change in business environment?
Recall Our Financial Analysis for Gap • Key factors • High gross margin • Sales and cost of sales would be key factors in forecasting • High fixed assets turnover ratio • Net PPE is probably related to sales
What’s happened so far this year? • Review the 10-Qs • Let’s look at Gap’s 1st quarter 10-Q • Imagine you had an interview with Gap. The interviewer tosses you a copy of the 10-Q and says, “What do you think?” • How could you analyze the F/S in 5 minutes?
A Quick Look at 10-Q: • Need to know industry and competitive strategy to be able to know what to look for and how to evaluate recent changes (or lack thereof) • Look at Income Statement: $, ratio, and trend • Net income and EPS • one-time items? • Sales • Gross Margin Percent • SG&A, R&D • Tax rate
Balance Sheet Current ratio amount and % of inventory A/R turnover Inventory turnover L-T Debt to Equity Statement of Cash Flow Cash flow from operations greater than zero? greater than NI? why? What is the company doing with the cash? Investing Financing A Quick Look at 10-Q:
I/S and MD&A Increase in net sales More stores Drop in net sale per average square foot Old Navy (low margin) Higher COGS and operating expense; but % remain similar as in 1999 Slight decrease in NI% B/S More inventory and PPE More debt! SCF Lower OCF! More inventory More capital expenditures Expansion Positive financing cash flows Quick Look at Gap’s 10Q (Q1 of 2000)
Back to Forecasting • Armed with background knowledge about the company and recent trends, we can turn to the forecast • A spreadsheet program, for example, Excel, will be extremely helpful
Key Driver: Sales • The behavior of sales: • Mean reverting of sales growth • Growth in sales over time revert to a mean value • demand saturation, competition • “random walk with drift” process • 2000 sales = 1999 sales plus a “drift” term • drift can be based on past trend in sales and output of prior analyses • Time-series analysis: e.g. Box and Jensen modeling • Have your spreadsheet for Gap ready!
Seasonality • Compare with the same quarter in previous years • Gap’s sales 1998 1999 • Q1(4/30) $1,720 $2,278 • Q2(7/31) 1,905 2,453 • Q3(10/30) 2,400 3,045 • Q4(1/31) 3,030 3,859 (Dollar amounts in millions)
Forecasting: Step 1—Sales • How would you forecast sales for McDonalds? • Number of stores • new versus old • domestic versus foreign • “same store sales” in the past, adjusted for • Relation between sales and general economic factors • Demographic trends • New menus • New advertising • Competitors’ activities • Average of past performance does not work well!
Trend? Company and Industry Annual and Quarterly Products? Customer mix? Geographic mix? Sources WSJ Interactive press releases news articles Economic indicator Lexis/Nexis Search for news, trade publications Value Line et al. Sales Forecast for Gap
Sales Forecast for Gap (case) • Past three years: 15%, 14%, 13% • Refinements: • Management state 20% of growth • New stores: domestic and foreign • Turnaround in economy • Trend: reducing by 1% • E.G. • 1992: 20% growth = $2,519*(1+20%) = $3,023 • 1993: 19% growth = $3,597 • Stabilized at 15% from 1997 and on
Earnings • This is what many analysts are trying to predict • But, research show that it also tends to follow a “random walk with drift” process • 2000 NI = 1999 NI plus “drift” term • This is especially true when forecasting for the longer range • Adjusted for the data found in most recent quarterly results • We will check whether our earnings forecast make sense as a “by product”
Return on Equity • ROE is also “mean reverting” • High ROE firms will attract competition • Unless there are sustainable barriers to entry • Unless growing capital base can be reinvested at above average returns • Low ROE firms will improve or go out of business • Regression to mean of 10-15% ROE in no more than 10 years for US firms • Consider whether GAAP distorts ROE • missing “assets “at high tech firms, and pharmaceuticals understates ROE • We will again check whether our ROE prediction make sense or not
Forecasting: Step 2—Expenses • Expenses should be forecast item by item • Many expenses are related with sales • COGS, SG&A • R&D in the long-run • Interest is a function of debt level and interest rates • Depreciation is a function of PPE, lease decisions • Taxes are a function of pretax income and operating decisions (e.g., location) • Equity earnings are a function of the affiliates’ performance • Interest income is a function of investment decisions • Need to consider changes over time
Forecast Gap’s Expenses • COGS • recent history and trends: 60% in 1991, tend to increase • Begin with 60%, increased by 0.5% annually; stabilized at 65.5% • SGA • recent history and trends: 23% of sales; not changing too much • R&D • MD&A, recent history • None for Gap • Interest • recent rates, forecast debt levels • Taxes • % of pretax income
Forecast Gap’s Expenses • Depreciation • Depend on PPE (forecast of B/S) and depreciation rate • PPE • Tax on EBIT • Tax rate: 38% • Deferred tax assets/liabilities: assumed immaterial
Forecast Gap’s Expenses • Interest • 8.87% on a new debt • about 8.9% before tax • S-T debt: 0.2% of TA as in 1991 • L-T liability: 12.1% of TA as in 1991 • Net interest after tax = average of S-T and L-T debt*8.9%*(1-38%)
Expenses—Forecast Refinements • Gross Margin Percent • by product • by region • Fixed and Variable SGA • Taxes • analysis of tax footnote • news about tax breaks, e.g. foreign countries
There May Be More • Investment Income • Marketable Securities • Excess cash
Forecasting: Step 3—Balance Sheet • As with expenses, forecast item by item • Current Assets • Cash • From cash flow forecast (?) • Desired cash balance • Gap: 3.5% of sales as in 1990 • MS • Cash flow forecast • Investment plans • A/R: turnover tied with Sales forecast • Inventory: turnover tied with Sales forecast • Other: likely related to Sales • Gap • Non-cash CA 15% of sales as in 1990 and 1991
Forecasting: Step 3—Balance Sheet • Net PPE: turnover tied with Sales forecast, investing activities (capital expenditure), depreciation policy • Other Non-Current: acquisition plans? • Gap: Net PPE and other, 23% of sales as in 1991 • Liabilities • Current: function of Sales, target current ratio • Noncurrent: function of CAPEX, capital structure decisions • Gap: see “Interest” discussion
Forecasting: Step 3—Balance Sheet • Equity • Retained Earnings = Opening RE + NI - Dividends ± Other capital transactions • Capital Stock = Opening CS + Issuances – Repurchases and retirements • Other equity items (foreign currency translation gains/losses,unrealized gains and losses on available for sale MS) are difficult to forecast. Assume no change?
Forecasting Cash Flows • With pro forma I/S and B/S, we should be able to develop SCF • Key factors (all related to other F/S): • Depreciation: from I/S • Capital expenditure • PPE(net), ending – PPE(net), beginning + Depreciation • Deferred tax • Assumed no change • Financing • Changes in S-T and L-T debt • Dividend payment • Assume all available cash is paid to the owners
Forecasting: Summary • Forecasting involves all prior steps in the framework • Comprehensive, iterative approach • Start with sales, determine operating costs • Are balance sheet changes required? • More capital expenditures? • How will they be financed? • Use I/S and B/S to forecast B/S • Forecast of SCF may lead to changes in asset levels (depreciation should be reexamined), and debt levels (interest expense and income should be reexamined) • Always a good idea to conduct ratio and sensitivity analyses on the forecasted numbers
Sensitivity Analysis • Best guess versus optimistic versus pessimistic • What if … • Competition heats up? Increase in operating costs? • A product doesn’t make it to market? • A merger doesn’t go through? • A worker strike?