Download
1 / 14
140 likes | 260 Vues
Explore NOAA's MSU satellites, their accuracy in atmospheric temperature measurements, bias correction methods, and dataset availability for reanalysis. Learn about calibration procedures, trend patterns, and challenges for accurate temperature trend representation.

E N D
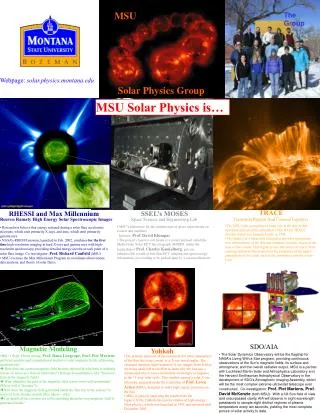
Consistent MSU Radiance Dataset for Reanalysis Cheng-Zhi Zou NOAA/NESDIS/Center for Satellite Applications and research CFSRR First Advisory Board Meeting, NOAA Science Center, November 7, 2007
NOAA MSU Satellites • 4 channels to measure the atmospheric temperature profiles • No cloud contamination • Each satellite has a life cycle of a few years • Each satellite overlaps With other satellites—good for bias correction • LECT gradually changes With time– orbital drift phenomenon Satellite Local Equator Crossing Time (LECT) vs time MSU Scan Pattern and footprint sizes
Time series based on pre-launch calibrated radiance data • Different bias correction yield different trend results (Christy and Spenser, Mears and Wentz, Vinnikov and Grody, Zou et al.) • Reanalysis has its own bias correction procedure, how to ensure the reanalysis trend to represent the real atmospheric trend?
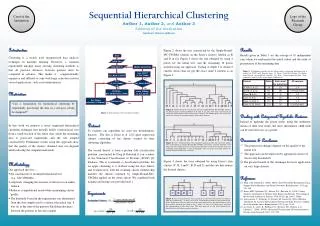
Simultaneous Nadir Overpass Method to find SNO matchups: • Use Cao’s (2004) method to find the orbits that have intersections • Use time and location information in the 1B file to determine simultaneity between two pixels Schematic viewing the overpasses between two NOAA satellites
MSU In-Orbit Calibration Process Cold Space T=2.73K MSU Sensor Warm Target Temperature is measured by PRT Earth Conceptual diagram of MSU observational procedure
Level 0 Calibration (Cw, Rw) (Ce, Re) Radiance (R) Onboard Warm Target (Ce, RL) Earth View (Cc , 2.73K) Cosmic Cold Target Digital Counts (C)
SNO Radiance Error Model k j Radiance Error Model for SNO Matchup K and J : • Consider colinearity between Zk and Zj • choose the coefficients that completely remove the warm target temperature contamination
Tb comparison for SNO matchups After pre-launch calibration After SNO calibration
Comparison Between Pre-launch and SNO calibration Time series differences for pre-launch calibration Std=0.1K Inter-satellite differences after SNO calibration std=0.04K
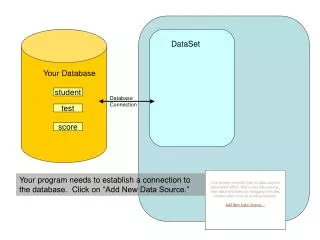
Independent validation dataset for reanalysis Website address: http://www.orbit.nesdis.noaa.gov/smcd/emb/mscat/mscatmain.htm • Datasets available: • Level 2 radiance: pre-launch (operationally) calibrated • SNO calibrated • Level 3 SNO calibrated gridded products: 2.502.50 pentad T2, T3, and T4, 1987-present pentad anomaly T2, T3, and T4, 1987-present monthly T2, T3, and T4, 1987-present monthly anomaly T2, T3, and T4,1987-present
Trend patterns T3 trend T23, Mid-tropospheric temperature trend, 1987-2006 T4, Lower Stratospheric temperature trend 1987-2006
Remaining issues • Efforts needed to resolve short overlap problem • between NOAA 10 and 9 for accurate bias removal • more calibration coefficients (higher order calibration • equation) maybe needed to solve Channel 3 for • NOAA 11 and 12 • Different frequencies between MSU and AMSU