Efficient Sequential Hierarchical Clustering for Large Datasets in Bioinformatics
This study introduces a novel sequential hierarchical clustering technique designed to handle large datasets efficiently. By initially constructing a hierarchical tree from a subset of the data, the method processes the remaining data in a one-pass setting, adapting the tree as new data points arrive. This approach significantly reduces computational costs while maintaining clustering quality. Evaluations using bioinformatics datasets, including gene expression clusters and protein fold classifications, demonstrate the effectiveness of this technique, highlighting its suitability for large-scale applications.

Efficient Sequential Hierarchical Clustering for Large Datasets in Bioinformatics
E N D
Presentation Transcript
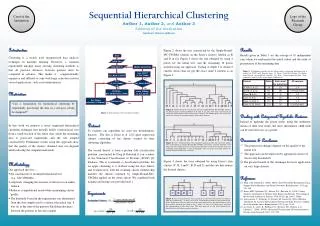
“Can a formulation for hierarchical clustering by sequentially processing the data in a one-pass setting be designed?” Sequential Hierarchical Clustering Author 1, Author 2, and Author 3 Address of the institution Authors’ Email address Crest of the Institution Logo of the Research Group Dataset To evaluate our algorithm we used two bioinformatic datasets. The first is Eisen et al. [2]’s gene expression clusters consisting of ten clusters formed by their clustering algorithm. The second dataset is from a protein fold classification problem, constructed by Ding & Dubchak [1] on a subset of the Structural Classification of Proteins (SCOP) [4] database. This is essentially a classification problem, but we apply clustering to it (without using the class labels) and evaluate how well the resulting cluster membership matches the clusters returned by Single-Round-MC-UPGMA applied on the entire subset. We combined both training and testing sets provided in [1]. Experiments Evaluation Criteria: Figure 2 shows the tree constructed by the Single-Round-MC-UPGMA scheme on the Eisen’s clusters labeled as B and D in [2]. Figure 3 shows the tree obtained by using 4 points for the initial tree, and the remaining 16 points inserted using our approach. Cutting at depth 1 to obtain 2 clusters shows that we get the exact same 2 clusters as in Figure 2. Figure 4 shows the trees obtained by using Eisen’s data clusters (C, B, I and C, B, D and I), and the cuts that returns the desired clusters. • Introduction • Clustering is a widely used unsupervised data analysis technique in machine learning. However, a common requirement amongst many existing clustering methods is that all pairwise distances between patterns must be computed in advance. This makes it computationally expensive and difficult to cope with large scale data used in several applications, such as in bioinformatics. • Motivation • In this work we propose a novel sequential hierarchical clustering technique that initially builds a hierarchical tree from a small fraction of the entire data, while the remaining data is processed sequentially and the tree adapted constructively. Preliminary results using this approach show that the quality of the clusters obtained does not degrade while reducing the computational needs. • Methodology • Our approach involves … • the construction of an initial hierarchical tree (e.g., MC-UPGMA). • adaptively changing the structure of the tree in an online fashion. • Reduces computational needs while maintaining cluster quality. • The threshold θ used in the experiments was determined from the data sample used to construct the initial tree. θ was set as the sum of the pairwise Euclidean distances between the patterns in this data sample. • Results • Results given in Table 1 are the average of 10 independent runs where we randomised the initial subset and the order of presentation of the remaining data. • Dealing with Categorical/Symbolic Features • Instead of updating the parent nodes using the arithmetic means of their leaf nodes, the most informative child node can be selected to act as a parent. • Discussion & Conclusion • The proposed technique depends on the quality of the initial tree. • The approach can be improved by appropriate choice of the novelty threshold θ. • The greatest benefit of this technique lies in its application on very large datasets. • Reference • [1]. Ding, C.H., Dubchak, I. (2001). Multi-class Protein Fold Recognition using • Support Vector Machines and Neural Networks. Bioinformatics 17(4), pp. • 349–358. • [2]. Eisen, M.B., Spellman, P.T., Brown, P.O., Botstein, D. (1998). Cluster • Analysis and Display of Genome-wide Expression Patterns. Proceedings of • the National Academy of Sciences USA 95(25), pp. 14863–14868. • [3]. Loewenstein, Y., Portugaly, E., Fromer, M., Linial, M. (2008). Efficient • Algorithms for Accurate Hierarchical Clustering of Huge Datasets: tackling • the entire protein space. Bioinformatics 24(13), pp. 41–49. • [4]. Lo Conte, L., Ailey, B., Hubbard, T.J., Brenner, S.E., Murzin, A.G., • Chothia, C. (2000). SCOP: a Structural Classification Of Proteins database. • Nucleic Acids Research, 28(1), 257–259. Start Initial Tree Update ancestor(s) New pointXi Table 1: Preliminary results of the hierarchical clustering performed on a subset of SCOP and Eisen’s data. (1) Beta: ConA-like lectins, (2) Alpha: Four-helical up-anddown bundle, (3) Beta: Immunoglobulin-like beta-sandwich, and (4) A/B: beta/alpha (TIM)-barrel. new_ROOT (Xi,Cur_Node) Cur_Node = ROOT Yes Cur_Node=ROOT dist (Xi,Cur_Node) >θ Yes No No Children = get_children(Cur_Node) make_Sibling (Xi,Cur_Node) Children={Φ} Cur_Node= min(dist(Xi,Children)) No Yes Figure 2: Hierarchical tree constructed by the Single-Round-MC-UPGMA scheme on Eisen’s data clusters labelled as B and D [2]. The tree was constructed by using the whole data of the selected two clusters. The dendrogram was cut at the root node (shown in dotted lines) to obtain two clusters. Figure 1: Flow diagram of the proposed method. Figure 3: Tree constructed by the proposed approach with the aid of an initial tree constructed by Single-Round-MC-UPGMA on Eisen’s clusters labelled as B and D [2]. The initial tree was constructed with 20% of the data and the rest was clustered using Algorithm 1. The dendrogram was cut at the root node (shown in dotted lines) to obtain two clusters. Figure 4: Tree constructed by our approach on the selected clusters of Eisen’s data (a) Clusters B, C, D and I; 30 out of 124 data were used for the construction of the initial tree. The tree was cut at the level indicated by the dotted line to yield four perfect clusters. (b) Clusters B, C, and I; 25 out of 113 data were used for the construction of the intial tree. The tree was cut at the level indicated by dotted line to yield three perfect clusters.