Download
1 / 47
470 likes | 498 Vues
Explore the intricate relationship between atmospheric energy distribution and global temperature patterns. Learn about energy pathways, heat transfer mechanisms, the greenhouse effect, temperature controls, and more. Discover how factors like latitude, altitude, and land-water heating differences influence Earth's climate. Gain insights into urban heat islands and their impact on local temperatures. Enhance your knowledge of Earth's temperature patterns and the human-body response to temperature variations.

E N D
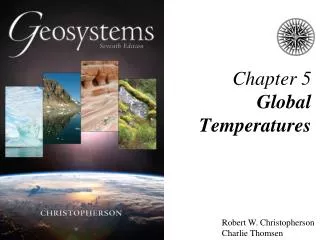
Atmospheric Energy and Global Temperatures • Energy Essentials • Energy at Earth’s Surface • Temperature Concepts and Controls • Earth’s Temperature Patterns • The Urban Environment
Insolation Figure 3.2
Energy Pathways Figure 3.1
Energy Pathways • Transmission • Scattering • Refraction • Albedo and Reflection
Refraction Figure 3.4
Refraction Figure 3.3
Albedo and Reflection Figure 3.5
Clouds and Albedo Figure 3.6
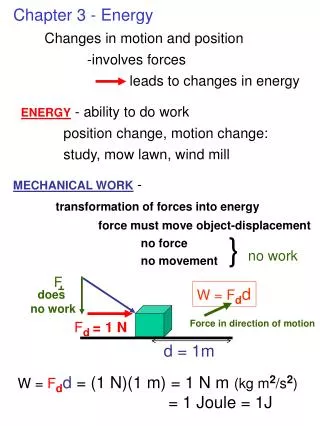
Heat Transfer • Conduction • Molecule-to-molecule transfer • Convection • Energy transferred by movement • Advection • Horizontally dominant movement • Radiation • Energy traveling through air or space
Heat Transfer Figure 3.7
Energy Balance in the Troposphere • The Greenhouse Effect and Atmospheric Warming • Clouds and Earth’s “Greenhouse” • Earth–Atmosphere Radiation Balance
The Greenhouse Effect and Atmospheric Warming • Atmosphere absorbs heat energy • A real greenhouse traps heat inside • Atmosphere delays transfer of heat from Earth into space
Clouds and Earth’s “Greenhouse” Figure 3.8
Outgoing Shortwave Energy Figure 3.9
Outgoing Longwave Energy Figure 3.9
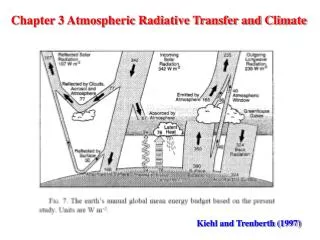
Earth–Atmosphere Radiation Budget Figure 3.10
Energy Balance at Earth’s Surface • Daily Radiation Patterns • Simplified Surface Energy Balance • The Urban Environment
Daily Radiation Patterns Figure 3.12
Simplified Surface Energy Balance • NET R = • + SW (insolation) • – SW (reflection) • + LW (infrared) • – LW (infrared) Figure 3.13
Temperature Concepts and Controls • Temperature Scales • Measuring Temperature • Principal Temperature Controls • Land–Water Heating Differences
Temperature Scales • Fahrenheit • Celsius • Kelvin
Temperature Scales Figure 3.15
Principal Temperature Controls • Latitude • Affects insolation • Altitude • High altitude has greater daily range • High altitude has lower annual average • Cloud Cover • High albedo • Moderate temperatures – cooler days, warmer nights
Effects of Latitude Figure 3.17
Altitude Figure 3.18
Land–Water Heating Differences • Evaporation • Transparency • Specific heat • Movement • Ocean currents and sea surface temperatures • Marine vs. continental effects
Land–Water Heating Differences Figure 3.20
The GulfStream Figure 3.21
Average Sea Surface Temperatures in 1999 from Pathfinder AVHRR Satellite
Marine and Continental Climates Figure 3.23
Marine and Continental Climates Figure 3.25
Earth’s Temperature Patterns • January Temperature Map • Thermal equator movement southward • More movement over large continents • July Temperature Map • Thermal equator movement northward • More movement over large continents • Annual Range of Temperatures • Continentality
January Temperatures Figure 3.24
July Temperatures Figure 3.26
Global Temperature Ranges Figure 3.28
The Urban Environment Figure 3.29
Urban Heat Island Figure 3.30
Air Temperature and the Human Body • Wind chill • Correlates cold and wind speed • Heat index • Correlates heat and humidity
Wind Chill Table Figure 1
Heat Index Table Figure 2