Download
1 / 20
220 likes | 376 Vues
Carbon Dioxide and Global Temperatures. 10.7 Chapter 19 (pp. 525-534). Let’s explore the “evidence” that increased concentrations of greenhouse gases is causing the Earth to become warmer. Was this caused by human activities?

E N D
Carbon Dioxide and Global Temperatures 10.7 Chapter 19 (pp. 525-534)
Let’s explore the “evidence” that increased concentrations of greenhouse gases is causing the Earth to become warmer. • Was this caused by human activities? • Gas Concentrations & Temperatures of the Past Compared to the Present day
IPCC (1988) • Intergovernmental Panel on Climate Change • 3,000 scientists globally • What are the effects of global warming? (biodiversity, energy fluxes, economic, social) • What do we know? • What do we need to know?
Early CO2 Understanding • If excess CO2 is present, then it will be absorbed by the oceans and vegetation • Two CO2 measurements several years apart is sufficient
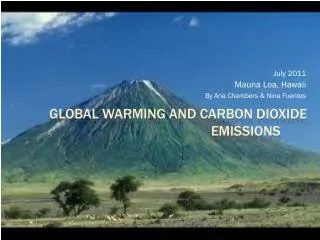
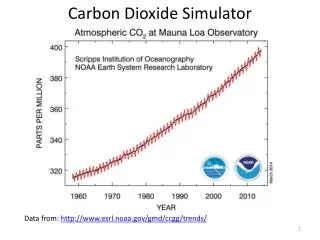
Keeling, Mauna Loa Observatory PROVED: CO2 levels are seasonal and concentration of CO2 is increasing each year
Developed Nations • Per capita consumption of fossil fuels greatest • 20% of world population producing 75% of global CO2 • That all changes in 2009
1880 to 2009 Trends • Global temperatures increased 0.8oC (1.4oF) • Of the ten warmed years, 9 occurred between 2000-2009 • This temperature increase in not evenly distributed around the globe • The Northern lattitudes changed 1-4oC • 40% of the Northern ice cap has melted
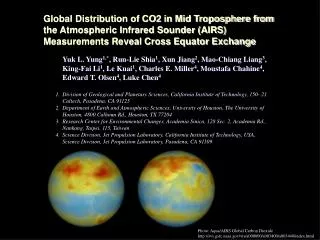
Global Temperatures and Greenhouse Gas Concentrations for the Past 400,000 years • Changes in species composition • Ice core analysis
Formaminifera: different species prefer different water temperatures Air bubbles trapped in ice core samples
The figure below presents historical CO2 levels. Use the graph to determine the net change in atmospheric Carbon Dioxide concentration between 100,000 years ago and present day levels.
There was little change in concentration over 10,000 years, but DRASTIC change as of 1800
Consensus of Climate Modeling • Average global temperatures will increase 1.8 to 4oC (3.2-7.2oF) by 2100