Chapter 4 Using Probability and Probability Distributions
Chapter 4 Using Probability and Probability Distributions. Chapter Goals. How to use models to make decisions. Why Model?. Example.

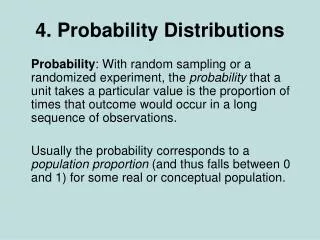
Chapter 4 Using Probability and Probability Distributions
E N D
Presentation Transcript
Chapter 4Using Probability and Probability Distributions Fall 2006 – Fundamentals of Business Statistics
Chapter Goals • How to use models to make decisions Fall 2006 – Fundamentals of Business Statistics
Why Model? Fall 2006 – Fundamentals of Business Statistics
Example Suppose we wish to compare two drugs, Drug A and Drug B, for relieving arthritis pain. Subjects suitable for the study are randomly assigned one of the two drugs. Results of the study are summarized in the following model for the time to relief for the two drugs. Fall 2006 – Fundamentals of Business Statistics
Introduction to Probability Distributions • Random Variable • Represents a possible numerical value from a random event Random Variables Discrete Random Variable Continuous Random Variable Fall 2006 – Fundamentals of Business Statistics
Discrete Random Variables • Can only assume a countable number of values Example: • Roll a die twice. Let X be the random variable representing the number of times 4 comes up. Then, X takes can be Fall 2006 – Fundamentals of Business Statistics
Discrete Probability Distribution X=x P(X=x) 0 1 2 Experiment: Toss 2 Coins. Let X = # heads. 4 possible outcomes Probability Distribution T T T H H T .50 .25 Probability H H Fall 2006 – Fundamentals of Business Statistics 0 1 2 x
Discrete Probability Distribution The probability mass function of a discrete variable is a graph, table, or formula that specifies the proportion associated with each possible value the variable can take. The mass function p(X = x) (or just p(x)) has the following properties: • All values of the discrete function p(x) must be between 0 and 1, both inclusive, and • if you add up all values, they should sum to 1. Fall 2006 – Fundamentals of Business Statistics
Example • Let X represent the number of books in a backpack for students enrolled at KSU. The probability mass function for X is given below: Fall 2006 – Fundamentals of Business Statistics
YDI 6.11 Consider the following discrete mass function: • Complete the table • P(X<3.1)= • P(X≥-1.1)= • P(2 < X < 3)= Fall 2006 – Fundamentals of Business Statistics
Discrete Random Variable Summary Measures • Expected Value of a discrete distribution(Average) E(X) = xi P(xi) • Example: Toss 2 coins, X = # of heads x P(x) 0 .25 1 .50 2 .25 Fall 2006 – Fundamentals of Business Statistics
Discrete Random Variable Summary Measures (continued) • Standard Deviation of a discrete distribution where: E(X) = Expected value of the random variable Fall 2006 – Fundamentals of Business Statistics
Discrete Random Variable Summary Measures (continued) • Example: Toss 2 coins, x = # heads, compute standard deviation (recall E(x) = 1) Possible number of heads = 0, 1, or 2 Fall 2006 – Fundamentals of Business Statistics
Continuous Variables A density function is a (nonnegative) function or curve that describes the overall shape of a distribution. The total area under the entire curve is equal to one, and proportions are measured as areas under the density function. Fall 2006 – Fundamentals of Business Statistics
The Normal Distribution • ‘X ~ N(μ, σ2) means that the variable X is normally distributed with mean μ and variance σ2 (or standard deviation σ). • If X ~ N(μ, σ2), then the standardized normal variable Z = (X−μ)/σ ~N(0,1). Z is called the standard normal. The random variable has an infinite theoretical range: + to f(x) σ x μ Mean = Median = Mod Fall 2006 – Fundamentals of Business Statistics
Many Normal Distributions By varying the parametersμand σ, we obtain different normal distributions Fall 2006 – Fundamentals of Business Statistics
Properties of the Normal Distribution • Symmetric about the mean μ. • Bell-shaped • Mean = Median = Mode • Approximately 68% of the area under the curve is within ±1standard deviation of the mean. • Approximately 95% of the area under the curve is within ±2 standard deviation of the mean. • Approximately 99.7% of the area under the curve is within ±3 standard deviation of the mean. Note: Any normal distribution N(μ, σ2) can be transformed to a standard normal distribution N(0,1) Fall 2006 – Fundamentals of Business Statistics
Empirical Rules μ ± 1σencloses about 68% of x’s What can we say about the distribution of values around the mean? There are some general rules: f(x) σ σ x μ-1σ μ μ+1σ 68.26% Fall 2006 – Fundamentals of Business Statistics
The Empirical Rule (continued) • μ ± 2σcovers about 95% of x’s • μ ± 3σcovers about 99.7% of x’s 3σ 3σ 2σ 2σ μ x μ x 95.44% 99.72% Fall 2006 – Fundamentals of Business Statistics
Translation to the Standard Normal Distribution Translate from x to the standard normal (the “z” distribution) by subtracting the mean of x and dividing by its standard deviation: Fall 2006 – Fundamentals of Business Statistics
Finding Normal Probabilities Probability is the area under thecurve! Probability is measured by the area under the curve f(x) ) P ( a x b x a b Fall 2006 – Fundamentals of Business Statistics
Example Let the variable X represent IQ scores of 12-year-olds. Suppose X~N(100,256). Jessica is a 12-year-old and has an IQ score of 132. What proportion of 12-year-olds have IQ scores less than Jessica’s score of 132? Fall 2006 – Fundamentals of Business Statistics
YDI 6.1 • Find the area under a standard normal distribution between z = 0 and z = 1. 22. • Find the area under a standard normal distribution to the left of z = −2. 55. • Find the area under a standard normal distribution between z = −1. 22 and z = 1. 22. Fall 2006 – Fundamentals of Business Statistics
YDI 6.2 Consider the previous IQ Scores example, where X~N(100,256). • What proportion of the 12-year-olds have IQ scores below 84? • What proportion of the 12-year-olds have IQ scores 84 or more? • What proportion of the 12-year-olds have IQ scores between 84 and 116? Fall 2006 – Fundamentals of Business Statistics
Empirical Rules μ ± 1σcovers about 68% of x’s μ ± 2σcovers about 95% of x’s μ ± 3σcovers about 99.7% of x’s f(x) σ σ μ-1σ μ x μ+1σ 68.26% Fall 2006 – Fundamentals of Business Statistics
Example Suppose cholesterol measures for healthy individuals have a normal distribution. Kyle’s standardized cholesterol measure was z = −2. Using the 68-95-99 rule, what percentile does Kyle’s measure represent? Lee’s standardized cholesterol measure was z = 3. 2. Does Lee’s cholesterol seem unusually high? Fall 2006 – Fundamentals of Business Statistics
YDI 6.4 Different species of pine trees are grown at a Christmas-tree farm. It is known that the length of needles on a Species A pine tree follows a normal distribution. About 68% of such needles have lengths centered around the mean between 5.9 and 6.9 inches. • What are the mean and standard deviation of the model for Species A pine needle lengths? • A 5.2-inch pine needle is found that looks like a Species A needle but is somewhat shorter than expected. Is it likely that this needle is from a Species A pine tree? Fall 2006 – Fundamentals of Business Statistics
YDI 6.6 The finishing times for swimmers performing the 100-meter butterfly are normally distributed with a mean of 55 seconds and a standard deviation of 5 seconds. • The sponsors decide to give certificates to all those swimmers who finish in under 49 seconds. If there are 50 swimmers entered in the 100-meter butterfly, approximately how many certificates will be needed? • What time must a swimmer finish to be in the top fastest 2% of the distribution of finishing times? Fall 2006 – Fundamentals of Business Statistics
The Standard Normal Table The Standard Normal table in the textbook (Appendix D) gives the probability from the mean (zero) up to a desired value for z .4772 Example: P(0 < z < 2.00) = .4772 z 0 2.00 Fall 2006 – Fundamentals of Business Statistics
The Standard Normal Table The value within the table gives the probability from z = 0 up to the desired z value (continued) The columngives the value of z to the second decimal point The row shows the value of z to the first decimal point . . . 2.0 .4772 P(0 < z < 2.00) = .4772 2.0 Fall 2006 – Fundamentals of Business Statistics
General Procedure for Finding Probabilities • Draw the normal curve for the problem in terms of x • Translate x-values to z-values • Use the Standard Normal Table To find P(a < x < b) when x is distributed normally: Fall 2006 – Fundamentals of Business Statistics
Z Table example Suppose x is normal with mean 8.0 and standard deviation 5.0. Find P(8 < x < 8.6) Calculate z-values: 8 8.6 x Z Fall 2006 – Fundamentals of Business Statistics
Solution: Finding P(0 < z < 0.12) Standard Normal Probability Table (Portion) P(8 < x < 8.6) = P(0 < z < 0.12) .02 z .00 .01 .0478 .0000 0.0 .0040 .0080 .0398 .0438 .0478 0.1 0.2 .0793 .0832 .0871 Z 0.00 0.3 .1179 .1217 .1255 0.12 Fall 2006 – Fundamentals of Business Statistics
Finding Normal Probabilities • Suppose x is normal with mean 8.0 and standard deviation 5.0. • Now Find P(x < 8.6) Z 8.0 8.6 Fall 2006 – Fundamentals of Business Statistics
Upper Tail Probabilities • Suppose x is normal with mean 8.0 and standard deviation 5.0. • Now Find P(x > 8.6) Z 8.0 8.6 Fall 2006 – Fundamentals of Business Statistics
Upper Tail Probabilities (continued) • Now Find P(x > 8.6)… Z 0 Fall 2006 – Fundamentals of Business Statistics
Lower Tail Probabilities • Suppose x is normal with mean 8.0 and standard deviation 5.0. • Now Find P(7.4 < x < 8) 8.0 7.4 Fall 2006 – Fundamentals of Business Statistics
Quiz Problems • The distribution of resistance for a certain type of resistors is known to be normal; 2.5% of these resistors have a resistance exceeding 15 ohms and 2.5% have resistance smaller than 8 ohms. What is the standard deviation of this resistance distribution? Fall 2006 – Fundamentals of Business Statistics
Quiz Problems • For a population under study, the variable weight follows a normal distribution. If the variance in weights is 100 and the 20th percentile corresponds to 114 pounds, what is the mean weight? Fall 2006 – Fundamentals of Business Statistics