Download
1 / 127
1.27k likes | 1.46k Vues
“In the Driver’s Seat” 2008 AutoVantage Road Rage Survey Final Report. Prepared by: May 1, 2008. Contents. I. Executive Summary Research Sponsor Research Purpose Research Methodology Research Sample Key Findings II. Detailed Findings Observations of Various Behaviors

E N D
“In the Driver’s Seat”2008 AutoVantage Road Rage SurveyFinal Report Prepared by: May 1, 2008
Contents I. Executive Summary Research Sponsor Research Purpose Research Methodology Research Sample Key Findings II. Detailed Findings Observations of Various Behaviors Reactions to Rude or Aggressive Drivers Frequency of Performing Various Behaviors Effectiveness of Various Actions in Reducing Road Rage III. Appendix 2008 AutoVantage Road Rage Survey Prince Market Research 2
Research Sponsor: AutoVantage • The sponsor of this national study is AutoVantage, a national automobile membership club. It provides car-buying and ownership services and savings to more than 2 million members. • Members of AutoVantage can save from 5 to 20 percent on car care at some 19,000 service locations, including participating AAMCO, Jiffy Lube, Meineke and American Care Center locations. AutoVantage also offers 24-hour nationwide emergency towing, roadside assistance, and lockout protection from its network of more than 10,000 emergency roadside assistance providers. Trip routing for maps and door-to-door driving directions across the U.S are also included. AutoVantage is offered by Affinion Group, a leader in the membership, insurance and loyalty marketing businesses, providing products and services that touch the lives of millions of Americans. 2008 AutoVantage Road Rage Survey Prince Market Research 4
Research Purpose • AutoVantage was interested in conducting follow-up research to a study they commissioned in both 2006 and 2007. • The overall purpose of this research was to gather information on the driving habits and attitudes on the topic of “Road Rage.” • AutoVantage once again partnered with Prince Market Research (PMR), an independent market research company, to conduct a national opinion poll on this topic. 2008 AutoVantage Road Rage Survey Prince Market Research 5
Research Methodology • The questionnaire contained 34 questions and was approved by both parties. • The questionnaire was similar to the one used in 2007. • The following two questions were removed from this year’s questionnaire: • How effective would increased police presence on certain roads or intersections be in reducing road rage in your city? • How effective would conducting a widespread “public awareness campaign” in order to reduce the amount of aggressive driving be in reducing road rage in your city? • The following four questions were added to this year’s questionnaire: • How often do you see drivers who are texting, emailing, and/or using their Blackberry while driving? • How often do you see drivers who are eating or drinking while driving? • How often do you send text messages, emails, and/or used your Blackberry while driving? • How often do you eat or drink while driving? 2008 AutoVantage Road Rage Survey Prince Market Research 6
Research Methodology • One substantive change was made to the wording of a key question. In 2006 and 2007, respondents were asked the following: In terms of rude drivers, how do you think the drivers in your metropolitan area compare with the drivers in other major cities? Would you say that the drivers in your metropolitan area are more courteous than the drivers in other major cities, less courteous than those in other cities, or about the same? This key question was altered in 2008 to help clarify that it is road rage in particular that is being measured, not just rude drivers. In terms of road rage, how do you think the drivers in your metropolitan area compare with the drivers in other major cities? Would you say that the drivers in your metropolitan area are more courteous (meaning they exhibit less road rage) than the drivers in other major cities, less courteous (meaning they exhibit more road rage) than those in other cities, or about the same? • In order to broaden the pool of respondents that were interviewed, there was also a slight change in the qualifications for this year’s survey. To qualify for this year’s survey, respondents still had to be 21 years of age or older. Instead of personally driving to work at least 10 minutes during rush hour every day of the week, though, respondents had to drive at least 10 minutes during rush hour at least three days of the week, Monday through Friday. 2008 AutoVantage Road Rage Survey Prince Market Research 7
Research Methodology • During the period February 4th through March 23rd, 2008, a total of n=2,512 telephone interviews were completed with a random sampling of consumers in 25 major metropolitan areas in the United States. • A minimum of 100 interviews were completed in each of the 25 designated metropolitan areas. • Interviews averaged 6-8 minutes in length. • No incentive for participation was offered, and the sponsor of the research was not revealed. • The margin of error for the full sample (n=2,512) is +/-2.0%. The margin of error for each of the individual 25 markets is larger. 2008 AutoVantage Road Rage Survey Prince Market Research 8
Research Sample • In 2006, interviews were conducted with consumers in 20 metropolitan areas. In 2007, the number increased to 25 metropolitan areas. • For 2008, interviews were conducted with consumers in the same 25 cities as last year; however, more up-to-date U.S. Census Bureau estimates were used, altering the relative size and population ranking of the cities from 2007. • It is also important to note that Riverside/San Bernardino, according to the updated estimates, is now considered its own metropolitan area; however for comparison purposes to previous years, Riverside/San Bernardino is represented in the Los Angeles market, and Sacramento remains the 25th market tested. 2008 AutoVantage Road Rage Survey Prince Market Research 9
Research Sample *Note: The cities on this chart are listed in order of the top 25 most populated metropolitan statistical areas and metropolitan divisions in the United States, based on the July 1, 2006, U.S Census Bureau estimates. 2008 AutoVantage Road Rage Survey Prince Market Research 10
Key Findings • For the third consecutive year, Miami was revealed as the city with the least courteous drivers among the 25 metropolitan areas included in the study. Fifteen percent (15%) of respondents in Miami said that drivers in their city were more courteous than drivers in other major cities, while 61% said drivers in their city were less courteous than drivers elsewhere. • The ten cities with the least courteous drivers for 2008 include: #1- Miami #6- Atlanta #2- Boston #7- Los Angeles #3- New York #8- Phoenix #4- Baltimore #9- Dallas (tie with Tampa) #5- Washington DC #9- Tampa (tie with Dallas) *Note: As was the case in 2006 and 2007, rankings are based on computing a “net courtesy score” for each of the 25 markets. See page 24 for detailed results. 2008 AutoVantage Road Rage Survey Prince Market Research 11
Key Findings • This year, Pittsburgh moved up a spot from being the #2 city with the most courteous drivers in 2007 to the #1 city among the 25 metropolitan areas included in the study. Over one-half (55%) of respondents in Pittsburgh said drivers in their city are more courteous than drivers in other major cities. • The ten cities with the most courteous drivers for 2008 include: • #1- Pittsburgh #6- Cincinnati • #2- Portland #7- Sacramento • #3- Seattle #8- Chicago • #4- Minneapolis #9- San Diego • #5- Cleveland #10- San Francisco *Note: As was the case in 2006 and 2007, rankings are based on computing a “net courtesy score” for each of the 25 markets. See page 23 for detailed results. 2008 AutoVantage Road Rage Survey Prince Market Research 12
Key Findings • In 2006, Minneapolis emerged as the city with the most courteous drivers, whereas last year, it landed in the middle of the rankings at 12. Minneapolis has moved back into the top 10 list, being the #4 city with the most courteous drivers in 2008. • Sacramento moved up from being the 18th most courteous in 2007 to #7 this year, while Chicago also made a leap from #19 to #8. • St. Louis (#4 most courteous in 2007) and Denver (#6 most courteous in 2007) moved down the list to #12 and #13, respectively. • Baltimore fell from the middle of the pack in 2007 (#11) to the #22 city with the most courteous drivers in 2008. 2008 AutoVantage Road Rage Survey Prince Market Research 13
Key Findings • As was the case in 2007, angry drivers emerged as the most frequently mentioned response when asked “what does the term ‘Road Rage’ mean to you.” • Aggressive driving, including bad, dangerous drivers and those that cut people off, tailgate, speed, and/or honk was the second most frequently mentioned response. • Impatient drivers and inconsiderate drivers were mentioned by a handful of respondents. • When asked “what would you say are the major causes of Road Rage,” the following themes emerged: • Bad/careless/poor drivers/driving, including cutting off other drivers, speeding, making obscene gestures, and not using proper signals • Anger, stress, frustration, bad day/temper, personal issues, tired • People being in a hurry, impatient, running late • Inconsiderate/disrespectful/selfish drivers that think they own the road 2008 AutoVantage Road Rage Survey Prince Market Research 14
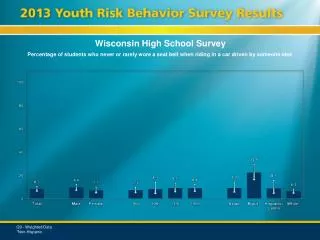
Key Findings • Commuters see the following road rage inducing behaviors by other drivers in their metropolitan area every day: • Talking on cell phone (88% see this every day) • Driving too fast (59%) • Tailgating (56%) • Texting and/or Emailing and Eating and/or Drinking while driving, both new questions in 2008, scored relatively high with 38% of commuters observing people texting/emailing while driving and 49% observing on a daily basis commuters who eat/drink while driving. • Commuters in Miami were the most likely to observe drivers in their city cutting over without notice, while commuters in New York were the most likely to observe drivers in their city tailgating, on a daily basis. 2008 AutoVantage Road Rage Survey Prince Market Research 15
Key Findings • Honking their horn (43%) was the most frequently admitted reaction to rude or aggressive drivers among these commuters. • Other reactions to rude driving were as follows: • Cursed at another driver (36%) • Waved your first or arms at another driver (11%) • Made an obscene gesture at another driver (9%) • Called and reported another driver (8%) • Slammed into the back of a bad driver (1%) • Younger drivers are more likely to honk their horn and curse at another driver, while those with a longer commute are more likely to make an obscene gesture at another driver. 2008 AutoVantage Road Rage Survey Prince Market Research 16
Key Findings • Commuters in this national study were most likely to admit doing the following behaviors themselves every day: • Talking on cell phone while driving (22% do every day) • Eat or drink while driving (20%) • Driving too fast (12%) • Young drivers, and those with longer commutes, were the most likely to confess to driving too fast on a daily basis. 2008 AutoVantage Road Rage Survey Prince Market Research 17
Key Findings • When asked how effective certain mandates would be in reducing road rage, close to six in ten commuters said that limiting cell phone usage to “hands free” only would definitely be effective. • Limiting cell phone usage to “hands free” only (59%) • Using automatic cameras to record traffic violations (56%) • Making it illegal to use a cell phone while driving (52%) • Older drivers were more likely to report that limiting cell phone usage to hands free only and making it illegal to use a cell phone while driving would be effective in reducing road rage. Women were slightly more likely than men to agree with this as well. 2008 AutoVantage Road Rage Survey Prince Market Research 18
II. Detailed Findings Note: Because individual answers are rounded up or down, totals will not always equal 100%.
Drivers are More/Less Courteous Here • Q: In terms of road rage, how do you think the drivers in your metropolitan area compare with drivers in other major cities? *The wording for this question was changed slightly from previous periods. 2008 AutoVantage Road Rage Survey Prince Market Research 20
Drivers are More/Less Courteous Here 2008 AutoVantage Road Rage Survey Prince Market Research 21
Drivers are More/Less Courteous Here 2008 AutoVantage Road Rage Survey Prince Market Research 22
“Most Courteous” City Rankings *Note: The “net courtesy score” was computed by taking the percentage of those that said drivers in their area were “more” courteous than drivers in other areas minus the percentage that said drivers in their area were “less” courteous than drivers elsewhere. 2008 AutoVantage Road Rage Survey Prince Market Research 23
“Least Courteous” City Rankings *Note: The “net courtesy score” was computed by taking the percentage of those that said drivers in their area were “more” courteous than drivers in other areas minus the percentage that said drivers in their area were “less” courteous than drivers elsewhere. 2008 AutoVantage Road Rage Survey Prince Market Research 24
Q: What does the term “Road Rage” mean, to you? Angry drivers was the most frequently mentioned response, as about 60% of all respondents mentioned this. It was also the most popular response in 2007. Drivers that overreact to other drivers and/or traffic conditions Drivers that lose their tempers, sometimes even getting physical (Making an obscene gesture, running drivers off the road, getting out of the car, threatening/yelling at other drivers, pulling out a weapon, etc.) Out of control/Violent drivers Angry/Upset/Frustrated/Mad drivers Aggressive driving was mentioned by approximately 30% of all respondents. Aggressive drivers who cut people off, tailgate, speed, and/or honk Bad/Careless drivers Dangerous/Erratic/Reckless/Rude driving Impatient drivers (≈5%) and inconsiderate drivers (≈2%) were also mentioned. Definition of Road Rage 2008 AutoVantage Road Rage Survey Prince Market Research 25
Q: What would you say are the major causes of Road Rage? (respondents could mention up to three causes) The most frequently mentioned themes were: ≈75% of respondents mentioned Bad/careless/immature/poor drivers/driving: cutting off other drivers, improperly changing lanes, speeding, going too slow, tailgating, talking on cell phone, blowing horn, slamming on brakes, making obscene gestures, not using proper signals ≈45% of respondents mentioned Anger, stress, aggression, frustration, bad day/temper, personal issues, tired ≈40% of respondents mentioned People being in a hurry, impatient, running late ≈20% of respondents mentioned Inconsiderate/disrespectful/discourteous/selfish/ rude drivers; Drivers thinking they own the road/They are the priority Causes of Road Rage *Respondent could provide more than one answer to this question. 2008 AutoVantage Road Rage Survey Prince Market Research 26
Observed: Overall Summary 2008 AutoVantage Road Rage Survey Prince Market Research 28
Observed: Overall Summary 2008 AutoVantage Road Rage Survey Prince Market Research 29
Observed: Cutting Over Without Notice • Q: How often do you see the following road rage inducing behavior by others in your metro area: drivers cutting into your lane with little or no warning/notice? 2008 AutoVantage Road Rage Survey Prince Market Research 30
Observed: Cutting Over Without Notice 2008 AutoVantage Road Rage Survey Prince Market Research 31
Observed: Cutting Over Without Notice 2008 AutoVantage Road Rage Survey Prince Market Research 32
Observed: Tailgating • Q: How often do you see the following road rage inducing behavior by others in your metro area: drivers who tailgate? 2008 AutoVantage Road Rage Survey Prince Market Research 33
Observed: Tailgating 2008 AutoVantage Road Rage Survey Prince Market Research 34
Observed: Tailgating 2008 AutoVantage Road Rage Survey Prince Market Research 35
Observed: Slamming on Brakes • Q: How often do you see the following road rage inducing behavior by others in your metro area: drivers who slam on their brakes at the last minute? 2008 AutoVantage Road Rage Survey Prince Market Research 36
Observed: Slamming on Brakes 2008 AutoVantage Road Rage Survey Prince Market Research 37
Observed: Slamming on Brakes 2008 AutoVantage Road Rage Survey Prince Market Research 38
Observed: Running Red Lights • Q: How often do you see the following road rage inducing behavior by others in your metro area: drivers who run right through a light that has already turned red? 2008 AutoVantage Road Rage Survey Prince Market Research 39
Observed: Running Red Lights 2008 AutoVantage Road Rage Survey Prince Market Research 40
Observed: Running Red Lights 2008 AutoVantage Road Rage Survey Prince Market Research 41
Observed: Driving Too Fast • Q: How often do you see the following road rage inducing behavior by others in your metro area: drivers driving a lot faster than is safe for road or traffic conditions? 2008 AutoVantage Road Rage Survey Prince Market Research 42
Observed: Driving Too Fast 2008 AutoVantage Road Rage Survey Prince Market Research 43
Observed: Driving Too Fast 2008 AutoVantage Road Rage Survey Prince Market Research 44
Observed: Talking on Cell Phone • Q: How often do you see the following road rage inducing behavior by others in your metro area: drivers who are talking on their cell phone? 2008 AutoVantage Road Rage Survey Prince Market Research 45
Observed: Talking on Cell Phone 2008 AutoVantage Road Rage Survey Prince Market Research 46
Observed: Talking on Cell Phone 2008 AutoVantage Road Rage Survey Prince Market Research 47
Observed: Texting and/or Emailing • Q: How often do you see the following road rage inducing behavior by others in your metro area: drivers who are texting, emailing, and/ or using their Blackberry while driving? *This was a new question in 2008, therefore there are no comparisons to 2006 and 2007. 2008 AutoVantage Road Rage Survey Prince Market Research 48
Observed: Texting and/or Emailing 2008 AutoVantage Road Rage Survey Prince Market Research 49
Observed: Texting and/or Emailing 2008 AutoVantage Road Rage Survey Prince Market Research 50