Download
1 / 8
80 likes | 263 Vues
Statistical Modeling and Analysis of MOFEP. Chong He ( with John Kabrick, Xiaoqian Sun, Mike Wallendorf) Department of Statistics University of Missouri-Columbia. Outline. Review current statistical analysis Spatial structure Bayesian multivariate spatial modeling

E N D
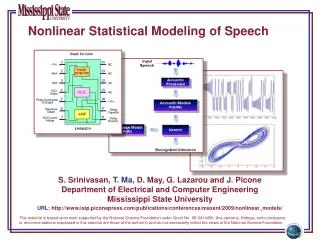
Statistical Modeling and Analysis of MOFEP Chong He ( with John Kabrick, Xiaoqian Sun, Mike Wallendorf) Department of Statistics University of Missouri-Columbia
Outline • Review current statistical analysis • Spatial structure • Bayesian multivariate spatial modeling • Our progress and challenge • New research: sampling design?
Current statistical analysis models for MOFEP studies • Complete random block (Sheriff & He): -- using compartment as unit, -- 9 data points each year, -- 5 unknown parameters: 2 for blocks, 2 for treatments, and 1 for variance; • Split-plot (Sheriff & He): -- using ELT as unit, -- to test treatment effect: 9 data points and 5 unknown -- to test ELT related effects: 18 data points & 10 unknown (assume 2 ELT per compartment). • Split-plot with repeated measurements (Sheriff & He): -- using ELT as unit & repeat over year.
Current statistical analysis models for MOFEP studies (cont.) • Meta-analysis (Gram et al): -- using compartment as unit, -- based on effective size dj=(MT - MC )/SDTC cumulative effective size d+ • Others, such as regression & ANOVA: -- using sample plot as unit, -- lots of data ( assume data points are independent), -- resulting large type I error (indicate a significant treatment effect when there is not), the error rate could be as high as 40%. α = .05 is based on independency assumption.
Spatial structure • Physical and biological variables observed in nature display spatial patterns (gradients and patches); • Patterns may result either from deterministic processes or from processes causing spatial autocorrelation, or both; Model 1 (spatial dependence): yj = µj + f (explanatory variablesj) + εj Model 2 (spatial autocorrelation): yj = µj + Σi f (yi - µ y) + εj Model 3 (combination of model 1&2): yj = µj + f1 (explanatory variablesj) + Σi f2 (yi - µ y) +εj Model 4 : explanatory variablesj may themselves be modeled by model 3.
Bayesian multivariate spatial model • Bayesian method likelihood f(y| θ) + prior (θ) posterior (θ|y) -- all the inference are based on the posterior -- informative & non-informative priors • Bayesian multivariate spatial model yj = µj + f1 (explanatory variablesj) + Σif2 (yi - µ y) +εj, yj , µj are vectors priors on unknown parameters -- latent variables: response variable and explanatory variables may be measured at difference location or scale. -- Please discuss your research questions with us and we can help you!
Our progress and challenge • One Ph.D. student started to work on the modeling this semester. • Transfer geo-data from GIS system to Splus system. • Start developing Bayesian spatial model on vegetation data. Challenge: too many variables to work with.
New research: sampling design? • We may use the developed model to address the sampling problem such as: -- do we need more or less sample points? -- where to add more sample points? -- how often?