Statistical Modeling
Statistical Modeling. Matthew Dirk Wiers. Purpose.

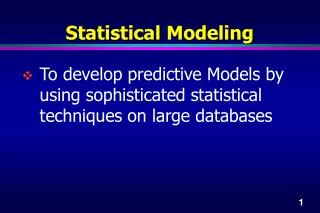
Statistical Modeling
E N D
Presentation Transcript
Statistical Modeling Matthew Dirk Wiers
Purpose Statistical modeling is a mathematical technique used to verify and quantify associations between one or more quantitative and/or qualitative predictor variables (x1, x2, …), and a single quantitative or qualitative response variable (y), or multiple multivariate normal response variables (y1, y2, …). E.g., the association between income (x1), whether or not someone at home cooks (x2), and the number of dinners in the last k eaten outside the home (y).
Components • Probability Model: f (y, θ) Discrete: Bernoulli, Binomial, Poisson, Multinomial Continuous: Normal, Weibull, Multivariate Normal • Linear Model:β0 + β1x1i + β2x2i + … • Link:θi= g (β0 + β1x1i + β2x2i + …)
Components • Maximum Likelihood Estimation: • Likelihood Ratio Tests:
Probability Models Suppose there is a 6 week experiment with 15 animals in treatment group A and 15 animals in treatment group B. Consider the following measurements on each animal: • Whether or not there were malignant tumors. • The number of tumors that were malignant. • The number of tumors. • The average size of the tumors. • The time to the first tumor. • The number of tumors that were malignant, benign, or other. • The average size and average weight of the tumors. The corresponding probability models are Bernoulli, Binomial, Poisson, Normal, Weibull, Multinomial, and Multivariate Normal.
Statistical Modeling • Bernoulli Modeling • Binomial Modeling • Binomial Probit Modeling • Binomial C-Log-Log Modeling • Poisson Modeling • Poisson Rate Modeling • Multinomial Modeling • Multinomial Ordinal Modeling
Statistical Modeling • Normal Modeling • Weibull Modeling • Weibull Censor Modeling • Multivariate Normal Modeling • Multivariate Normal RM Modeling
Bernoulli Modeling • Probability Model:
Bernoulli Modeling • Link:
Bernoulli Modeling • NLL:
Binomial Modeling • Probability Model:
Binomial Modeling • Link:
Binomial Modeling • NLL:
Binomial Probit Modeling • Link: • NLL:
Binomial C-Log-Log Modeling • Link: • NLL:
Poisson Modeling • Probability Model:
Poisson Modeling • Link: • NLL:
Poisson Rate Modeling • Link: • NLL: