QM Implementation Based on CoP, PDCA, and GSBPM
QM Implementation Based on CoP, PDCA, and GSBPM. Statistics Iceland. Statistics Iceland. Small statistical office with ca 100 employees Still it requires a substantial statistical and technical infrastructure

QM Implementation Based on CoP, PDCA, and GSBPM
E N D
Presentation Transcript
QM Implementation Based on CoP, PDCA, and GSBPM Statistics Iceland
Statistics Iceland • Small statistical office with ca 100 employees • Still it requires a substantial statistical and technical infrastructure • No board – the Director-General is directly responsible to the relevant ministry or minister • Statistics Iceland is the main producer and coordinator of statistics in Iceland
Statistics Iceland • Four divisions • Economic Statistics • Social Statistics • Business Statistics • Resources and Services • Quality manager hired in a full time position 2012 • First as part of Resources and Services • Now directly under the Director-General
Quality Policy Quality Policy of Statistics Iceland Statistics Iceland is a professionally independent institution which develops, produces and disseminates statistics about society. Statistics Iceland’s policy is to work according to sound methodology and appropriate statistical procedures and with impartiality, objectivity and statistical confidentiality. The statistics are accurate and reliable, coherent and comparable. The statistics are according to users’ needs, released in a timely and punctual manner and presented in a clear and understandable form. In order to realize this, Statistics Iceland‘s professional independence is specified in law and it is ensured that staff has adequate training and experience to meet current statistical needs. Statistics Iceland is responsible for official statistics in Iceland and needs to ensure that statistics are internally coherent and comparable, processing of data collecting is simplified, business and administrative sources used when possible with a sound methodology to avoid excessive burden on respondents. Statistics Iceland puts emphasis on good service, efficiency and cost effectiveness to meet increasing domestic and international demands. Statistics Iceland takes part in international cooperation and is fully compliant with the demands of the European Statistical System. Statistics Iceland operates within well-designed processes and according to plan. Quality indicators and other important factors regarding the operation and its outputs are well defined and results are checked accordingly. If quality indicators are not met changes will be carried out and improvements made on processes and procedures.The quality system of Statistics Iceland is based on the 15 principles of the European Statistics Code of Practice (CoP) published by the European Statistical System (ESS):1. Professional independence2. Mandate for data collection3. Adequacy of resources4. Commitment to quality5. Statistical confidentiality6. Impartiality and objectivity7. Sound methodology8. Appropriate statistical procedures9. Non-excessive burden on respondents10. Cost effectiveness11. Relevance12. Accuracy and reliability13. Timeliness and punctuality14. Coherence and comparability15. Accessibility and clarity
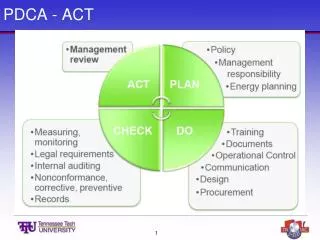
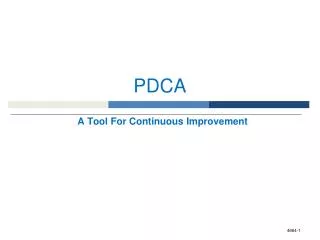
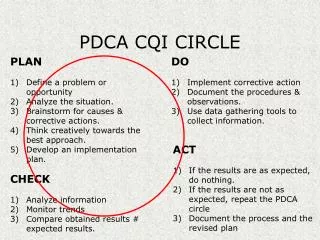
Quality Policy Quality Policy of Statistics Iceland Statistics Iceland is a professionally independent institution which develops, produces and disseminates statistics about society. Statistics Iceland’s policy is to work according to sound methodology and appropriate statistical procedures and with impartiality, objectivity and statistical confidentiality. The statistics are accurate and reliable, coherent and comparable. The statistics are according to users’ needs, released in a timely and punctual manner and presented in a clear and understandable form. In order to realize this, Statistics Iceland‘s professional independence is specified in law and it is ensured that staff has adequate training and experience to meet current statistical needs. Statistics Iceland is responsible for official statistics in Iceland and needs to ensure that statistics are internally coherent and comparable, processing of data collecting is simplified, business and administrative sources used when possible with a sound methodology to avoid excessive burden on respondents. Statistics Iceland puts emphasis on good service, efficiency and cost effectiveness to meet increasing domestic and international demands. Statistics Iceland takes part in international cooperation and is fully compliant with the demands of the European Statistical System. Statistics Iceland operates within well-designed processes and according to plan. Quality indicators and other important factors regarding the operation and its outputs are well defined and results are checked accordingly. If quality indicators are not met changes will be carried out and improvements made on processes and procedures.The quality system of Statistics Iceland is based on the 15 principles of the European Statistics Code of Practice (CoP) published by the European Statistical System (ESS):1. Professional independence2. Mandate for data collection3. Adequacy of resources4. Commitment to quality5. Statistical confidentiality6. Impartiality and objectivity7. Sound methodology8. Appropriate statistical procedures9. Non-excessive burden on respondents10. Cost effectiveness11. Relevance12. Accuracy and reliability13. Timeliness and punctuality14. Coherence and comparability15. Accessibility and clarity CoP Plan – Do – Check – Act (PDCA) CoP
Improvement System Quality Audits (ESS per review) Internal Audits User Surveys Process Model and Performance Indicators Program Management Visual Management System User Groups Improvement Ideas from Employees Methods for Problem Solving and Improvement Process for Suggestions and Complaints
Process Model Do research and forecasts Create and disseminate statistics Design products and services • Current condition • High Level Process Map Ensure secure supervision of finance Maintain housing and control access Maintain good human resources Ensure data security and provide suitable computer systems • Three core processes,produce products and services for customers • Four enabling processes, service the core processes (and each other) Get the right things done • One management process called Get the right things done
High Level Process Map - the highest level of the Process Model - Do research and forecasts Create and disseminate statistics Design products and services Ensure secure supervision of finance Maintain housing and control access Maintain good human resources Ensure data security and provide suitable computer systems Get the right things done
Process Model • Drill-down structure from each of the business processes on the High Level Process Map • Four levels • High Level Process Map (Level 0) • Business Processes (Level 1) • Standard Operating Procedures (Level 2) • Work Descriptions, Forms, Checklists, etc. (Level 3)
Process Model • Operating procedures answer essentially two questions: • What is done? • Who does it? • Work descriptions answer the question: • How is it done?
Statistical Business Process Many different products with different processes We started to map the statistical business processes just like all the other business processes, that is to say, on a blank piece of paper The same processes for different products were not comparable to each other We decided to start mapping the statistical business process using the GSBPM as a reference frame
GSBPM • To make the GSBPM usable for us • Translate to Icelandic • Around 20 meetings • All managers (heads of units) + one third of experts
Template based on the GSBPM for process mapping of the data collection process The process map is used as part of the operating procedures
An operating procedure for the CATI process drawn up from the previous template
Pros and Cons • Pros • Much quicker to map the processes • Much better to compare same processes for different products • Easier to communicate with colleagues in other countries on process matters • Cons • Some complications in the processes can easily be lost
Appendix 1: The Management Process Get the Right Things Done Create vision and strategy Improve Organize Review and evaluate Make plans