Reading LibQUAL+ Results
The University of Chicago Library. LibQUAL+ ™ Survey. Reading LibQUAL+ Results. Supervisors’ Meeting June 16, 2004. What is LibQUAL+? Survey Measures perceptions of service quality Outcomes-based Gap analysis. What is gap analysis?.

Reading LibQUAL+ Results
E N D
Presentation Transcript
The University of Chicago Library LibQUAL+™ Survey Reading LibQUAL+ Results Supervisors’ Meeting June 16, 2004
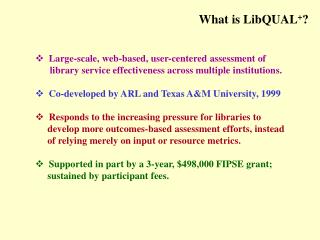
What is LibQUAL+? • Survey • Measures perceptions of service quality • Outcomes-based • Gap analysis
What is gap analysis? • Gap analysis in LibQUAL+ is based on each respondent ranking the library on each of 22+ items* (using a scale of 1 to 9) according to three questions: • What is my minimum acceptable level of service? • What is my desired level of service? • What is the library’s current level of service? * In LibQUAL+, items are statements. In other surveys, they may take the form of questions
What is gap analysis? Means scores are calculated using these individual responses. The differences between mean scores for the three levels (minimum, perceived, desired) are called “gaps”. Gaps are reported both for the individual item mean scores and for mean scores for groups of related items (called “dimensions”). The dimensions are: library as place affect of service information control
What are the gaps? • Service adequacy gap • Difference obtained by subtracting the minimum acceptable level from the perceivedlevel of service • Positive gap score indicates service is perceived as better than minimum level • Negative gap score indicates service is perceived as less than minimum level
What are the gaps? • Service superiority gap • Difference obtained by subtracting the desired level of service from the perceivedlevel of service • Positivegap score indicates perceived service exceeds the desired level • Negativegap score indicates perceived service is less than desired level
What does a gap look like? • The LibQUAL+ results notebook* presents information about gaps in various ways. • Tables • Radar charts • Gap bar charts * Results notebook may be found at:http://www.lib.uchicago.edu/staffweb/groups/libqual/results.html
Radar Chart Sample Faculty Results IC-3 IC-8 negative adequacy gap(red) Similar to p.62 results notebook
Radar Chart Sample Faculty Results IC-6 negative superiority gap(yellow) Similar to p.62 results notebook
Radar Chart Sample Faculty Results LP-5 positive superiority gap(green) Similar to p.62 results notebook
Radar Chart Sample Faculty Results LP-3 positive adequacy gap(blue) Similar to p.62 results notebook
Gap bar chart p.66 results notebook p.65 results notebook
Gap bar chart p.65 results notebook
Other Statistical Concepts Standard deviation: Measures the spread of a set of values or scores. A rule of thumb is that two standard deviations above and below the mean captures about 95% of the total spread of scores (assuming a normal distribution). Normal distribution: This is also referred to as a gaussian distribution or a bell curve. For surveys that measure attitudes or perceptions, a perfect normal distribution is uncommon.
Standard deviation Standard deviation of scores are reported in the results notebook. Different sets of scores can have the same mean, but a very different standard deviation. Larger standard deviations in LibQUAL+ means a diversity of perceptions – we expect this because our population has different needs, expectations, and perceptions. Here’s an example: The second set of scores is much more spread out than the first (higher standard deviation). This doesn’t mean the data is worse, just that there is a larger diversity of opinion.
In Summary LibQUAL+ results may be represented in different, but equally valid ways (radar, bar, table). Negative gaps show areas that need further study (or even action), but don’t tell you WHY the gaps are there. Further analysis is needed to see what other patterns may emerge and to help focus further assessment efforts and/or guide decision making.