Download
1 / 21
210 likes | 317 Vues
This study examines the housing landscape in Calgary’s South Sector, focusing on density, dwelling types, values, tenure, housing starts, dwelling age, and repairs. Analyses for 1991, 1996, and 2001 reveal trends and comparisons with city averages. The data includes dwelling type distribution, average dwelling value, tenure statistics, repairs required, and dominant construction periods. Statistics are based on Census Canada data from years 1991, 1996, and 2001, offering insights into the housing market dynamics of the area.

E N D
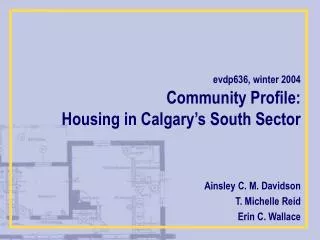
evdp636, winter 2004 Community Profile: Housing in Calgary’s South Sector Ainsley C. M. Davidson T. Michelle Reid Erin C. Wallace
CALGARY • Analysis of Housing • in Calgary’s South Sector • Density and Dwelling Type • Dwelling Value and Tenure • Housing Starts, Dwelling Age and Repair SOUTHSECTOR
Density (units/acre) Housing Type Other 44.6% Single- Detached 55.4% City average Other 31% Single- Detached 69% South Sector Average Density & Type: 1991
Density (units/acre) Housing Type Other 30% Single- Detached 70% Other 42.3% Single- Detached 57.7% City average South Sector Average Density & Type: 1996
Density (units/acre) Housing Type Other 40.4% Single- Detached 59.6% City average Other 29.8% Single- Detached 70.2% South Sector Average Density & Type: 2001
Average Dwelling Density 1991 2001 1996 Density: analysis
Average Dwelling Density across City and South Sector target: 4.2 to 5.6 City Core *note: City Core boundaries are the Bow River to the North, 14 Street to the West, and the Elbow River to the South and East. Density: analysis
Other 29.8% Single- Detached 70.2% Other 30% Single- Detached 70% Number of Dwellings Built, by Type South Sector Dwelling Type averages Other 31% Single- Detached 69% 1991 2001 1996 * note: includes apartments/ detached duplex ** note: includes movable Housing Type: analysis
Owned 59.7% Rented 40.3% Average Dwelling Value Tenure Rented Owned Rented 26.1% Owned 74.9% City average South Sector Average Value & Tenure: 1991
Rented 35.7% Owned 64.3% Average Dwelling Value Tenure Rented Owned Rented 21.8% Owned 78.2% City average South Sector Average Value & Tenure: 1996
Average Dwelling Value Tenure Rented Owned Rented 19.3% Owned 80.7% Rented 30.3% Owned 69.7% 2001 City average South Sector Average Value & Tenure: 2001
Average Dwelling Values 1991 2001 1996 Dwelling Value: analysis
Rented 19.3% Rented 21.8% Rented 26.1% Owned 80.7% Owned 78.2% Owned 74.9% Tenure South Sector Tenure averages 1991 1996 2001 Dwelling Tenure: analysis
Major Repairs required 6% Major Repairs not required 94% City average Dominant Period of Construction City Sector Dominant Period of Construction Repairs Major Repairs required 4% Major Repairs not required 96% South Sector Average Average Age & Repairs
Dwellings Units Built (per acre) 1971-1980 1981-1990 1991-2001 Dominate Period of Construction (by number of Census Tracks) City Housing Starts: 1971-2001
Dwellings Units Built (per acre) 1971-1980 1981-1990 1991-2001 Dominate Period of Construction (by number of Census Tracks) City Sector Sector Housing Starts: 1971-2001
Major Repairs Required (% of dwellings) Major Repairs required 5.4% Major Repairs not required 94.6% City average Major Repairs required 3.5% Major Repairs not required 96.5% South Sector Average Repairs: 1991
Major Repairs Required (% of dwellings) Major Repairs required 5.6% Major Repairs not required 94.4% City average Major Repairs required 4.2% Major Repairs not required 95.8% South Sector Average Repairs: 1996
Major Repairs Required (% of dwellings) Major Repairs required 5.4% Major Repairs not required 94.6% City average Major Repairs required 3.9% Major Repairs not required 96.1% South Sector Average Repairs: 2001
Major Repairs required 3.9% Major Repairs not required 96.1% Major Repairs required 4.2% Major Repairs not required 95.8% sector averages Major Repairs required 3.5% Major Repairs not required 96.5% 1991 1996 2001 Repairs: analysis