AMBER
AMBER. Areal Mean Basin Estimated Rainfall. AMBER Overview. All watersheds in county warning area are defined to a Minimum Basin Area (MBA) of 2 mi 2 to show spatial rainfall distribution. The WSR-88D polar grid (1 o by 1km) is mapped to the defined watersheds.

AMBER
E N D
Presentation Transcript
AMBER Areal Mean Basin Estimated Rainfall
AMBER Overview • All watersheds in county warning area are defined to a Minimum Basin Area (MBA) of 2 mi2 to show spatial rainfall distribution. • The WSR-88D polar grid (1o by 1km) is mapped to the defined watersheds. • Average Basin Rainfall (ABR) is computed for each watershed every volume scan. • An hourly ABR rate is determined from the single volume scan (5-6 min.) of ABR.
AMBER Watershed Division • All watersheds in the county warning area are divided into hydrologic segments no larger than 10 mi2. • A Minimum Basin Area of 2 mi2 is used in the initial NSSL stream creation procedure. • Each forecast office may modify the NSSL stream database (subdivide or aggregate).
DHR WSR-88D Bin AssignmentPolar grid 1o by 1km • DHR grid is mapped to all defined watershed segments. This allows ABR computation in 5-6 minute time steps. • DHR grid is mapped to all defined Urban Areas to compute ABR urban rainfall. • Single 1km DHR bins are assigned to location of all rain gages, allowing gage comparison with radar estimated rainfall.
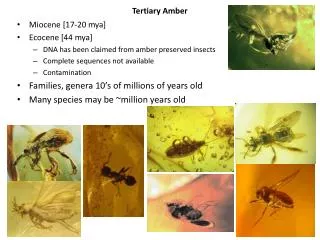
Pine Creek Aftermath • RADAP-II provided excellent rainfall estimates for bucket survey gages and for ABR in watersheds down to 3mi2 . • Disaster survey team recommended that a 1-hour flash flood guidance (FFG) be initiated. • Analysis of flash flood watersheds needed to be reduced from 10 mi2 to at least 3mi2.
Flash Flood Threat and ABR • Severity of flash flooding is directly related to the observed ABR in a watershed. • The time period of the ABR determines the ABR rate. The higher the ABR rate, the greater the risk of serious flash flooding. • ABR varies as function of watershed area. As watershed area increases, ABR and ABR rate tend to decrease.
FF Scale for Flash FloodingABR in inches • FF0 ABR = FFG to < FFG + 0.5 • FF1 ABR = FFG + 0.5 to < FFG + 1.5 • FF2 ABR = FFG + 1.5 to < FFG + 2.5 • FF3 ABR = FFG + 2.5 to < FFG + 3.5 • FF4 ABR = FFG + 3.5 to < FFG + 4.5 • FF5 ABR = FFG + 4.5 to < FFG + 5.5 • FF6 ABR = FFG + 5.5 or higher.
ABR Rate • Based on 5-6 minute observed ABR. • Hourly ABR Rate = ABR x 3600/vsec, where vsec= the number of seconds in the volume scan. • ABR Rate is used to identify watersheds currently receiving the heaviest rainfall, before the flash flood producing accumulation occurs.
AMBER Z/R Gage Comparison • The single 1km DHR bin that contains the rain gage is used to compute the radar rainfall estimate. • Tropical vs. Standard Z/R usage can be estimated using 15 minute gage data. • Gage comparisons should be done to verify validity of the WSR-88D rainfall estimates.
Pitcairn, PA Flash Flood 01-02July1997
Pittsburgh Urban Flash Flood May 18, 1999
AMBER Time Display Interval • 5-minute ABR: Used to compute ABR Rate and to sum the ABR through a 2 hour time period. • 15-minute ABR: Used for comparison with IFLOWS rain gage data and to sum the ABR through a 6 hour time period. • 1-hour ABR: Used for history of ABR in a watershed and to sum ABR through a 24 hour time period.
24 Hour ABR-Rainfall History • The history of ABR in a watershed for the past 24 hours can be compared with the MAP rainfall used to update FFG. • The AMBER 24 hour ABR product can be used to determine the rainfall distribution in any watershed for the previous 24-72 hours. • ABR is displayed in one hour increments with a running 24 hour total.
Forest Hills EMA Reports • 2215 UTC - First reports of water in basements. • 2300 - 0100 UTC many cars stranded along Ardmore Boulevard. • 0056 UTC - 10/homes/20 people evacuated on Kenmore Avenue.