Download
1 / 27
290 likes | 472 Vues
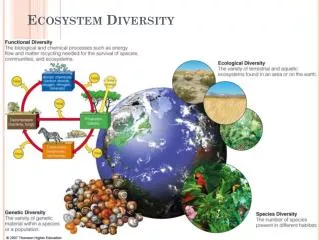
Does Biological Diversity Control Ecosystem Function? Donald R. Zak School of Natural Resources & Environment University of Michigan. Human Activity and the Loss of Biological Diversity. Clearing and Fragmentation of Tropical Forests. Human Activity and the Loss of Biological Diversity.

E N D
Does Biological Diversity Control Ecosystem Function? Donald R. Zak School of Natural Resources & Environment University of Michigan
Human Activity and the Loss of Biological Diversity Clearing and Fragmentation of Tropical Forests
Human Activity and the Loss of Biological Diversity Fire Suppression in Temperate Grasslands
Human Activity and the Loss of Biological Diversity Introduction of Exotic Predators Red Fox Brown Rat Common Mongoose Brown Tree Snake
Biological Diversity & Ecosystem Function What happens to ecosystem function when the abundance of particular species or groups of species are reduced?
Biological Diversity & Ecosystem Function Research into the influence of biological diversity on ecosystem function has been motivated by three basic questions: Does biological diversity influence rates of ecosystem processes? Is the relationship positive or negative? What mathematical expression describes this relationship?
What are the Mechanisms Linking Plant Diversity to Ecosystem Function? Lack of specific mechanisms linking plant diversity & ecosystem function, especially for the influence of plant diversity on higher trophic levels.
Plant Diversity, Microbial Communities & Ecosystem Function:Are There Any Links? Organic Substrates Production & Biochemistry Soil Environment Temperature & Water Potential Soil Microbial Communities Composition & Function
Plant Diversity & Microbial Communities Conceptual Model Plant Community Composition & Diversity + Litter Production Above- & Belowground + Substrate Availability Amount & Biochemical Composition + Soil Microbial Community Composition & Function + Ecosystem Processes Soil C & N Cycling
Hypotheses: Because plant species differ in their biochemical composition, changes in diversity should alter the production as well as range of compounds in detritus that limit, and thus control, the composition and function of heterotrophic microbial communities. Changes in microbial community composition & function will alter ecosystem C and N cycling.
Cedar Creek Natural History AreaBiodiversity Experiment Experimental Plant Diversity Treatments - 169 m2 Plots • Random Draw of 18 Native Grasses, Forbs, and Woody Plants • Species Richness Treatments • 1, 2, 4, 8, 16 Species • 30 Replications of Each Species Richness Treatment
Cedar Creek Natural History AreaBiodiversity Experiment Legumes Amorpha canescens Astragalus canadensis Lespedeza capatata Lupinus perennis Petalosetmum purpureum C4 Grasses Andropogon gerardi Buchloe dactyloides Panicum virgatum Schizachyrium scoparium Sorghastum nutans Sporobolus cryptandrus C3 Grasses Agropyron smithii Elymus canadensis Koeleria cristata Poa pretensis Woody Quercus ellipsoidalis Quercus macrocarpa Forb Monarda fistulosa
Cedar Creek Natural History AreaBiodiversity Experiment After 7 Years of Plant Growth in the Experimental Treatments, We Measured: Microbial Community Composition - Phospholipid Fatty Acid Analysis Microbial Community Function - Microbial Respiration - Gross Rates of Soil Nitrogen Cycling
Composition of Microbial Communities Lipid Analysis Phospholipid Fatty Acid Fatty Acids H H H H H H H H H H H H H H O | | | | | | | | | | | | | ||| Palmitic acid i16:0 H-C-C-C-C-C-C-C-C-C-C-C-C-C-C-C-OH | | | | | | | | | | | | | | H H H H H H H H H H H H H H H H H H H H H H H H H H H O | | | | | | | | | | | | ||| Linoleic acid 18:2w6 H-C-C-C-C-C-C=C-C-C=C-C-C-C-C-C-C-C-C-OH | | | | | | | | | | | | | | | | | H H H H H H H H H H H H H H H H H
Plant and Microbial Biomass Cedar Creek Old-Field Chronosequence Zak, D.R., et al. 1990. Biogeochemistry 11:111-119 30 20 Microbial Biomass g C/m-2 10 100 300 500 700 900 Total Plant Biomass g/m2
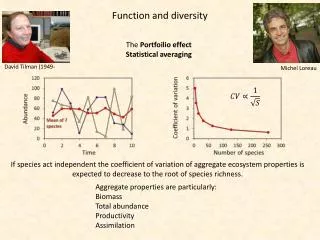
Plant Species Richness and Total Plant Biomass 1500 Analysis of Covariance - Adjust Means for Differences in Total Plant Biomass Among Diversity Treatments. R2 = 0.968 P < 0.001 1000 Total Plant Biomass g/m-2 Assumption: Total Plant Biomass is a Surrogate for Detritus Production in Plant Communities that are Rapidly Accumulating Biomass. 500 0 5 10 15 20 Number of Plant Species
Plant Species Richness and Microbial Community Biomass 19000 18000 R2 = 0.983 P < 0.001 Microbial Biomass pmol PLFA/g 17000 16000 15000 14000 0 5 10 15 20 Number of Plant Species
Plant Species Richness and Microbial Community Biomass Least Square Means Adjusted for Differences in Plant Biomass Among Diversity Treatments 18000 17000 Leaset Square Mean Microbial Biomass pmol PLFA/g 16000 15000 14000 0 5 10 15 20 Number of Plant Species
Plant Species Richness and Microbial Community Composition 0.240 0.226 R2 = 0.932 P < 0.001 0.212 Fungal PLFA:Bacterial PLFA 0.198 0.184 0 5 10 15 20 Number of Plant Species
16:15c * 4.2 * * * 3.8 * 3.4 1 2 4 8 16 2.1 10Me18:0 * 2.0 * * * * 1.9 1.8 1 2 4 8 16 Plant Species Richness and Microbial Community Composition Actinomycetes Fungi Bacteria Astericks are Least Square Means Adjusted for Plant Biomass 1.0 2.0 2.5 br 15:0 i17:0 i17:1 * * * * * * 1.9 2.3 * * * * 0.8 * * * * * 2.1 1.8 0.6 Mole Percent 1.9 1.7 0.4 16 1 2 4 8 1 2 4 8 16 16 1 2 4 8 10Me16:0 18:19c 17:0 * 4.8 0.58 7.6 * * 4.6 * * * * 0.54 * 7.2 * 4.4 * * * * * * 4.2 0.50 6.8 4.0 1 2 4 8 16 1 2 4 8 16 1 2 4 8 16 9.0 2.85 18:26 a10Me16:0 cy19:0 a17:0 * * * * * * 6.4 * 0.40 * * 7.0 * * * 2.75 * * * * * * 6.0 * * 5.0 0.36 2.65 5.6 3.0 0.32 2.55 5.2 1.0 1 2 4 8 16 16 8 1 2 4 8 16 1 2 4 1 2 4 8 16 Number of Plant Species
2.1 2.0 Least Square Mean Microbial Respiration mol CO2 • g-1 •d-1 1.9 1.8 1.7 1.6 1.5 0 5 10 15 20 Number of Plant Species Plant Species Richness and Microbial Respiration 2.5 R2 = 0.953 P < 0.001 2.0 Microbial Respiration mol CO2 • g-1 •d-1 1.5 1.0 0 5 10 15 20 Number of Plant Species
Plant Species Richness and Microbial Nitrogen Transformations 1.5 1.5 1.3 1.3 R2 = 0.799 P < 0.001 Gross N Mineralization g N • g-1• d-1 Gross N Immobilization g N • g-1• d-1 1.1 1.1 0.9 0.9 0.7 0.7 0 5 10 15 20 0 5 10 15 20 Number of Plant Species Number of Plant Species Gross mineralization was not greater in plots with legumes, compared to plots without legumes
Plant Species Richness and Gross Nitrogen Mineralization Adjusted for Differences in Plant Biomass & Soil Organic Matter Content 1.2 300 1.1 250 Least Square Means Gross N Mineralization g N • g-1• d-1 Gross N Mineralization mg N • g C -1• d-1 R2 = 0.320 P < 0.001 R2 = 0.668 P < 0.001 1.0 200 0.9 150 0 5 10 15 20 0 5 10 15 20 Number of Plant Species Number of Plant Species
Plant Species Richness and the Nitrogen Content of Plant Biomass 15 R2 = 0.967 P < 0.001 10 Total Plant Nitrogen g N m-2 5 0 5 10 15 20 Number of Plant Species
Plant Diversity, Microbial Communities & Ecosystem Function: Are There Any Links? Conclusions Plant Species Richness Indirectly Influenced Microbial Community Biomass, Fungal Abundance, and Respiration by Fostering Higher Plant Productivity and Detritus Inputs to Soil. Plant Species Richness Directly Increased Gross N Mineralization and N Supply to Plants, Which Fed Forward to Further Enhance Plant Productivity. Mechanisms for This Direct Effect?
Research Products from McIntire-Stennis Support Publications Zak, D.R., W.E. Holmes, D.C. White, A. Peacock & D. Tilman. 2003. Plant diversity, soil microbial communities and ecosystem function: are there any links? Ecology in press. Grant Submissions Zak, D.R. Plant diversity and ecosystem function are linked by soil microbial communities. Submitted to USDA Soils & Soil Biology Program - October 23, 2002.