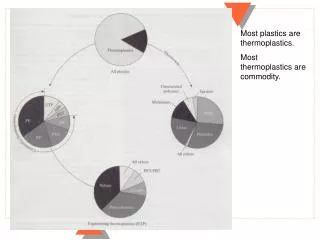
Plastics & Engineering Financial Analysis
Plastics & Engineering Financial Analysis. July 1993. Agenda. Objectives Approach Trend analysis Productivity analysis Points for discussion. Objectives. Analyze financial information to: Focus our analysis efforts and tasks Establish baseline Set context for business case

Plastics & Engineering Financial Analysis
E N D
Presentation Transcript
Agenda • Objectives • Approach • Trend analysis • Productivity analysis • Points for discussion
Objectives • Analyze financial information to: • Focus our analysis efforts and tasks • Establish baseline • Set context for business case • Understand key drivers of financial performance
Approach • Financial analysis • Analyzed: • 1989 - 1992 XXXX Financial Reports • 1993 YTD XXXX Financial Reports • 1992/1993 XXXX Budget • 1989 - 1992 Jeffersontown Plant Financial Report • 1993 YTD Jeffersontown Plant Financial Report • 1992 Frankfort Plant Financial Report • 1993 YTD Frankfort Plant Financial Report • Industry Analysis and Competitor Analysis • Internal Gemini Analysis • Informational Interviews
1 2 3 4 Financial Analysis Helps Identify the Path Forward for XXXX’s Change Program XXX Interviews • 8 Executive • 31 Focus Mfg Assessment • Louisville • Frankfort ParentCo Interviews Findings & Conclusions ParentCo Interface Study External View Project Design Financial Analysis & Business Case
1992 Financial Baseline ($MM) FY 1992 XXXXJeffersontownFrankfort • Total Sales 121.0 39.1 47.2 • Cost of Sales 102.0 36.4 41.3 • Materials – 25.7 29.0 • Direct Labor – 2.8 4.8 • Indirect Labor – 3.5 1.6 • Mfg. Overhead – 4.5 5.9 • Gross Profit 19.0 2.7 5.9 • S&E Expenses 4.8 1.6 0.2 • G&A Expenses 7.9 2.8 2.4 • Interest Expenses 1.1 0.6 0.3 • Net Income Before Taxes 5.2 (2.3) 3.0 • Total Inventories 10.2 3.3 3.5 • Accounts Receivable-Trade 15.0 5.6 5.0 • Net Fixed Assets 24.4 10.3 5.5 Source: XXXX & Engineering Financial report
JCI/Hyperion ParentCo Decatur ParentCo (Other) ParentCo Appliance Park ParentCo Appliance Park Other Other ParentCo Bloomington ParentCo Bloomington ParentCo ParentCo Rubbermaid ParentCo Is XXXX’s Largest Customer And Accounts For 65% Of Total Sales Jeffersontown Frankfort 1992 Sales = $47 M 1992 Sales = $39 M ParentCo Appliance Park 30.5% ParentCo Bloomington 34.6% ParentCo Decatur 15.0% Rubbermaid 6.7% JCI/Hyperion 4.5% Other 8.7% ParentCo Appliance Park 35.4% ParentCo Bloomington 28.3% ParentCo (Other) 14.5% Rev-A-Shelf 7.5% Other 14.3% Rev-A-Shelf In 1992 ParentCo bought $68 M (79% of total plant sales) from these 2 plants. Source; XXXX
$ in Millions Revenue Gross Profit Net Income 20 0 While XXXXs’ Revenue Has Grown Rapidly, Earnings Have Not Kept Pace 131 130 121 CGR = 26% 110 101 90 70 59 52 20 50 19 15 CGR = 22% 8 9 3.7 2.5 3.1 2.3 1 CGR = 10% 1989 1990 1991 1992 1993 Much of XXXXs recent growth has been driven by acquisitions. Source: XXXX Financial Reports and FY 1992/93 Budget Note: Figures include Rev- A- Shelf
22 20 18 16 14 12 10 8 6 4 2 0 1989 1990 1991 1992 1993 XXXX Margins Are Below Industry Norms 1991 Industry Average = 21% 17% Gross Margin 15.8% 15.3% 14.9% 14% Operating Margin 4.6% 1991 Industry Average = 4.6% 2.8% 2.6% 2.5% 1.7% Improving 1993 gross margins to industry average of 21% equals $7.5 million. Source For 1991 Industry Average: Plastics World, June ‘93
Relative To Recent Industry Benchmarks, XXXXs’ Cost Of Sales Appears To Be Squeezing Margins 1991 Industry XXXX Jeffersontown Frankfort Averagea % of % of % of % of $(M) Sales $(M) Sales $(M) Sales Sales • Sales 121.0 100% 39.1 100% 47.2 100% 100% • Direct Materials – – 25.7 66% 29.0 61% 39%b • Direct Labor – – 2.8 7% 4.8 10% 12% • Indirect Labor – – 3.5 9% 1.6 3% 8% • Overhead – – 4.5 12% 5.9 13% 21% • Cost of Sales 102.0 84% 36. 94% 41.3 88% 80% • Gross Margin 19.0 16% 2.7 6% 5.9 12% 20% • Selling, Engineer- • ing, General& 12.7 11% 4.4 11% 2.9 6% 16% • Administration • expenses • Operating margin 6.3 5% (1.7) (4%) 3.0 6% 4% a) Source: Plastics World, June 1993; stats rounded off for convenience b) Primarily resin
Frankfort Is 20% More Productive Than Jeffersontown Jeffersontown Frankfort Total Headcount = 395 a Expected 1993 Sales: $40 M Sales/Employee = $101,000 Total Headcount = 361 b Expected 1993 Sales: $45 M Sales/Employee = $125,000 Headcount for the two plants = 756; XXXX Total Headcount = 1300. a) Includes 76 office and 23 temporary personnel b) Includes 33 office and 103 temporary personnel Note: Product mix at the 2 plants is different
Resource Breakdown By Activity Setup (including material Receive Orders Ship & Receive Schedule Mold Assemble a Store handling) Jeffersontown 2 4 30 215 43 8 15 =317 b Frankfort 2 3 33 243 – 4 8 =293 c FY ‘91FY ‘925/93 Jeffersontown Total Headcount 415 421 395 Frankfort Total Headcount 322 329 361 Molding accounts for 75% of resources at the Jeffersontown and Frankfort plants. a) Includes assemble, trim, pack, clean, count and inspect b) Excludes support and corporate staff c) Excludes support staff
Industry Average 79% Frankfort ? 62% Jeffersontown 0 20 40 60 80 Capacity Utilization Capacity Utilization At XXXXs Lags Industry Average By A Wide Margin Machine uptime, productivity and scheduling adversely affect Jeffersontown capacity utilization. Source: Plastics World, Survey of Plastic Processors, June 1993 Capacity: 7 days, 24 hrs/day, 3 shifts 33 machines X 24 hours = 792 mfc hrs/day
0 20 40 60 80 XXXX Can Grow Revenue Significantly By Improving Capacity Utilization 79% Industry Average ? $ Frankfort 62% $11M Jeffersontown Capacity Utilization
14 12 10 8 6 4 2 0 FY1991 FY1992 As of 5/93 RM Components Pkg Material FG While Inventory Management Appears To Have Improved At Jeffersontown. . . Jeffersontown 4 3 2 1 0 FY 1991 FY 1992 As of 5/93 Source; XXXX Financial Reports
14 12 10 8 6 4 2 0 FY1991 FY1992 As of 5/93 RM Components Pkg Material FG . . . Frankfort May Well Present An Opportunity Frankfort 4 3 2 1 0 FY 1991 FY 1992 As of 5/93 Our initial analysis suggests that inventory management can be further improved. Source; XXXX Financial Reports
Raw Material Direct Labor Indirect Labor Manu. Overhead S&E Expense G&A Expense Interest Unless Operational Improvements Occur, Target 10 Will Drive Jeffersontown Deeper Into The Red In 1993 . . . Jeffersontown $40M Total Sales ($540 K) • Controllable • $26.1M $7.8 M • $6.7 M $5.5 M • $3.1M $1.3 M • $1.6 M $1.0 M • $2.9 M $2.5 M • $0.6 M – • $41M $18M Net Income Before Taxes } $41M Total Costs A 10% price reduction equates to a 13% ($2.3 million) reduction of controllable costs. Source: XXXX FY 1992/93 Budget
Raw Material Direct Labor Indirect Labor Manu. Overhead S&E Expense G&A Expense Interest . . . And Will Threaten Frankfort’s Profitability Frankfort $45M Total Sales Controllable $27.7 M $8.3 M $3.3 M $2.6 M $7.9 M $3.2 M $0.2 M $0.1 M $2.4 M $2.1 M $0.3 M – $42M $16M $2.6 M Net Income } $42M Total Costs A 10% price reduction equates to a 14% ($2.3 million) reduction of controllable costs. Note: Annualized on 6 months results ended 3/31/93
To Maintain Margins, Analysis Efforts Must Focus On Both Cost Efficiencies And Improving Capacity Utilization Cost Reduction Operating At Frankfort And Capacity Utilization Margin Jeffersontown to Improvement to Improvement Achieve Target 1 Achieve Target 2 $1 million 5.6% 3.2% $3 million 16.7% 9.2% $5 million 27.8% 15.3% 1) Excluding raw material cost 2) Assuming 25% incremental margin on additional sales
Content • Objective • Approach • Findings • Next Steps
Objective • To gain a thorough understanding of reporting relationships at the Jeffersontown and Frankfort Plants vis-a-vis industry norms • To graphically depict the numbers of direct reports at varying levels of the organization • To compare spans and reporting relationships between departments and functional areas
Approach • Reviewed and analyzed most recent (May ‘93) organization chart for Jeffersontown and Frankfort • Reviewed average spans of control by department
Hierarchical Levels • Aligned all Jeffersontown and Frankfort plant personnel by level • Plant Manager is considered to be Level 0 • Direct reports to the Plant Manager (Functional Managers) are considered Level 1 • Direct reports to Functional Managers (Department Managers) are considered Level 2, and so on . . . • Only those employees who supervise people are included in subsequent organizational levels to develop span of control relationships Our analysis covers the entire Jeffersontown and Frankfort operations personnel.
Jeffersontown Spans of Control Are Within Industry Norms Total Supervisor 7 14 18 – Total Headcount 9 47 83 201 Level 1 Level 2 Level 3 Level 4 0 1 2 3 4 5 6 7 8 9 10 Average Industry Spans – 1:7 to 1:9 Our analysis reveals that major functional areas are at or above industry norms.
Average Industry Spans – 1:7 to 1:9 By And Large, Frankfort Spans of Control Are Within Industry Norms Total Supervisor 7 9 – Total Headcount 9 20 294 Level 1 Level 2 Level 3 0 1 2 3 4 5 6 7 8 9 10 33 Level 3 shift supervisors have 80+ hourly employees reporting in to them.
Findings Jeffersontown • The Jeffersontown plant organization has only four management levels • Many functional areas have only two or three management levels • Overall spans of control appear to be in line with industry norms Frankfort • The Frankfort plant organization has only three management levels • Some Level 2 managers have spans of control below industry norms. However, these tend to be small departments with relatively few employees • 80+ hourly production workers report directly to Level 3 Shift Supervisors • Most other Level 3 managers have spans of control within industry norms
Conclusion • XXXX has a fairly optimal organizational structure and presents little opportunity to reduce overall headcount • There may be an opportunity to re-organize Frankfort plant operations to better align Shift Supervisors’ spans