Download
1 / 63
720 likes | 1.03k Vues
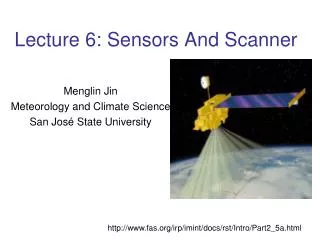
Lecture 6: Sensors And Scanner. Menglin Jin Meteorology and Climate Science San Jos é State University. http://www.fas.org/irp/imint/docs/rst/Intro/Part2_5a.html. Terra Orbit and Scanning. http://www.met.sjsu.edu/~jin/video/TerraOrbit.mpg.

E N D
Lecture 6: Sensors And Scanner Menglin Jin Meteorology and Climate Science San José State University http://www.fas.org/irp/imint/docs/rst/Intro/Part2_5a.html
Terra Orbit and Scanning • http://www.met.sjsu.edu/~jin/video/TerraOrbit.mpg
We will learn • Type of scanner • Type of detector • Spatial resolution • Spectral resolution • Swath width • Pixel • Field of view (FOV)
The Afternoon Constellation“A-Train” • The Afternoon constellation consists of 7 U.S. and international Earth Science satellites that fly within approximately 30 minutes of each other to enable coordinated science • The joint measurements provide an unprecedented sensor system for Earth observations
Radiometer—An instrument that quantitatively measures the intensity of electromagnetic radiation in some bands within the spectrum. Usually, a radiometer is further identified by the portion of the spectrum it covers; for example, visible, infrared, or microwave. • Spectrometer—A device that is designed to detect, measure, and analyze the spectral content of incident electromagnetic radiation. Conventional imaging spectrometers use gratings or prisms to disperse the radiation for spectral discrimination. • Sounder—An instrument that measures vertical distributions of atmospheric parameters such as temperature, pressure, and composition from multispectral information.
Advanced Very High Resolution Radiometer - AVHRR REVIEW • Band 1 Visible Channel (0.63 µm) • Band 2 Visible Channel (0.86 µm) • Band 3A NIR channel 1.58 - 1.64µm • Band 3B Shortwave IR Channel (3.74 µm) • Band 4 IR Window Channel (10.8 µm) • Band 5 IR Channel (12.0 µm) Resolution at Nadir
Then Spectroradiometer A radiometer that measures the intensity of radiation in multiple wavelength bands (i.e., multispectral). Many times the bands are of high-spectral resolution, designed for remotely sensing specific geophysical parameters The term spectroradiometer is reserved for sensors that collect the dispersed radiation in bands rather than discrete wavelengths NASA Earth System Science Remote Sensors http://earthdata.nasa.gov/data/references/nasa-earth-system-science-remote-sensors • Most air/space sensors are spectroradiometers.
again • Imaging spectroradiometer A radiometer that has a scanning capability to provide a two-dimensional array of pixels from which an image may be produced. Scanning can be performed mechanically or electronically by using an array of detectors. MODIS: The Moderate Resolution Imaging Spectroradiometer
we concentrate the discussion on optical-mechanical-electronic radiometers • and scanners, leaving the subjects of camera-film systems and active radar • for consideration elsewhere
Passive and Active Sensors • Passive Sensor: energy leading to radiation received comes from an external source, e.g., the Sun or objects that emit • Active Sensor energy generated from within the sensor system is beamed outward, and the fraction returned is measured; radar is an example
Imaging and non-imaging sensor • Non-imaging: measures the radiation received from all points in the sensed target, integrates this, and reports the result as an electrical signal strength or some other quantitative attribute, such as radiance
Imaging and non-imaging sensor • Non-imaging: measures the radiation received from all points in the sensed target, integrates this, and reports the result as an electrical signal strength or some other quantitative attribute, such as radiance • Imaging the electrons released are used to excite or ionize a substance like silver (Ag) in film or to drive an image producing device like a TV or computer monitor or a cathode ray tube or oscilloscope or a battery of electronic detectors
Aperture: In optics, an aperture is a hole or an opening through which light travels The aperture determines how collimated the admitted rays are, which is of great importance for the appearance at the image plane.
Most remote sensing instruments (sensors) are • designed to measure photons
Principal: photoelectric effect • There will be an emission of negative particles (electrons) when a negatively charged plate of some appropriate light-sensitive material is subjected to a beam of photons. The electrons can then be made to flow as a current from the plate, are collected, and then counted as a signal
Principal: photoelectric effect • There will be an emission of negative particles (electrons) when a negatively charged plate of some appropriate light-sensitive material is subjected to a beam of photons. The electrons can then be made to flow as a current from the plate, are collected, and then counted as a signal • Albert Einstein’s experiment (see lecture 3, or next slide)
Principal: photoelectric effect • There will be an emission of negative particles (electrons) when a negatively charged plate of some appropriate light-sensitive material is subjected to a beam of photons. The electrons can then be made to flow as a current from the plate, are collected, and then counted as a signal • Albert Einstein’s experiment (see lecture 3, or next slide) • Thus, changes in the electric current can be used to measure changes in the photons (numbers; intensity) that strike the plate (detector) during a given time interval. • The kinetic energy of the released photoelectrons varies with frequency (or wavelength) of the impinging radiation • different materials undergo photoelectric effect release of electrons over different wavelength intervals; each has a threshold wavelength at which the phenomenon begins and a longer wavelength at which it ceases.
Review photoelectric effect –measure photon energy level • the discovery by Albert Einstein in 1905 • His experiments also revealed that regardless • of the radiation intensity, photoelectrons are • emitted only after a threshold frequency is exceeded • for those higher than the threshold value (exceeding • the work function) the numbers of photoelectrons • released re proportional to the number • of incident photons
Handout “Detector types” • from John Schott “Remote Sensing –The Image Chain Approach”
Moving further down the classification tree, the optical setup for imaging sensors will be either an image plane or an object plane set up depending on where lens is before the photon rays are converged (focused), as shown in this illustration.
a diagrammatic model of an electro-optical sensor that does not contain the means to break the incoming radiation into spectral components
Scanning System If the scene is sensed point by point (equivalent to small areas within the scene) along successive lines over a finite time, this mode of measurement makes up a scanning system. Most non-camera sensors operating from moving platforms image the scene by scanning
2 Types of Scanner • Cross-Track Scanner the Whiskbroom Scanning • Along-Track Scanner the pushbroom scanning
Field of View (FOV) • Sensors that instantaneously measure radiation coming from the entire scene at once are called framing systems. The eye, a photo camera, and a TV vidicon belong to this group. The size of the scene that is framed is determined by the apertures and optics in the system that define the field of view, or FOV Question: What is FOV of your eyes?
Cross-Track Scanner the Whiskbroom Scanning A general scheme of a typical Cross-Track Scanner Swath width
Class activity: If w=1cm, calculate f For Terra and GOES
Essential Components of Cross-track Sensor • 1) a light gathering telescope that defines the scene dimensions at any moment (not shown) • 2) appropriate optics (e.g., lens) within the light path train • 3) a mirror (on aircraft scanners this may completely rotate; on spacecraft scanners this usually oscillates over small angles) • 4) a device (spectroscope; spectral diffraction grating; band filters) to break the incoming radiation into spectral intervals • 5) a means to direct the light so dispersed onto an array or bank of detectors • 6) an electronic means to sample the photo-electric effect at each detector and to then reset the detector to a base state to receive the next incoming light packet, resulting in a signal stream that relates to changes in light values coming from the ground targets as the sensor passes over the scene • 7) a recording component that either reads the signal as an analog current that changes over time or converts the signal (usually onboard) to a succession of digital numbers, either being sent back to a ground station Note: most are shared with Along Track systems
pixel The cells are sensed one after another along the line. In the sensor, each cell is associated with a pixel that is tied to a microelectronic detector Pixel is a short abbreviation for Picture Element a pixel being a single point in a graphic image Each pixel is characterized by some single value of radiation (e.g., reflectance) impinging on a detector that is converted by the photoelectric effect into electrons
MODerate-resolution Imaging Spectroradiometer (MODIS) • NASA, Terra & Aqua • launched 1999, 2002 • 705 km polar orbits, descending (10:30 a.m.) & ascending (1:30 p.m.) • Sensor Characteristics • 36 spectral bands (490 detectors) ranging from 0.41 to 14.39 µm • Two-sided paddle wheel scan mirror with 2330 km swath width • Spatial resolutions: • 250 m (bands 1 - 2) • 500 m (bands 3 - 7) • 1000 m (bands 8 - 36) • 2% reflectance calibration accuracy • onboard solar diffuser & solar diffuser stability monitor • 12 bit dynamic range (0-4095)
MODIS Onboard Calibrators Spectral Radiometric Calibration Assembly Solar Diffuser Blackbody Scan Mirror Space View Port Fold Mirror Nadir (+z)
MODIS Optical System Visible Focal Plane SWIR/MWIR Focal Plane Scan Track NIR Focal Plane LWIR Focal Plane
Four MODIS Focal Planes Shortwave IR/Midwave IR Visible Near-infrared Longwave Infrared
MODIS Cross-Track Scan on Terra MODIS_Swath http://eoimages.gsfc.nasa.gov/images/imagerecords/53000/53280/1.mov
Along-track Scanner pushbroom scanning the scanner does not have a mirror looking off at varying angles. Instead there is a line of small sensitive detectors stacked side by side, each having some tiny dimension on its plate surface; these may number several thousand 2-D array
NASA, EOS Terra Launched in 1999 polar, descending orbit of 705 km, 10:30 a.m. crossing Sensor Characteristics uses nine CCD-based push-broom cameras viewing nadir and fore & aft to 70.5° four spectral bands for each camera (36 channels), at 446, 558, 672, & 866 nm resolutions of 275 m, 550 m, or 1.1 km Advantages high spectral stability 9 viewing angles helps determine aerosol by µ dependence (fixed t) Multi-angle Imaging SpectroRadiometer (MISR)
Orbital characteristics 400 km swath 9 day global coverage 7 min to observe each scene at all 9 look angles MISR Pushbroom Scanner • Family portrait • 9 MISR cameras • 1 AirMISR camera
MISR Provides New Angle on Haze • In this MISR view spanning from Lake Ontario to Georgia, the increasingly oblique view angles reveal a pall of haze over the Appalachian Mountains
spectral resolution • The radiation - normally visible and/or Near and Short Wave IR, and/or thermal emissive in nature - must then be broken into spectral intervals, i.e., into broad to narrow bands. The width in wavelength units of a band or channel is defined by the instrument's spectral resolution • The spectral resolution achieved by a sensor depends on the number of bands, their bandwidths, and their locations within the EM spectrum
Spectral filters Absorption and Interference. Absorption filters pass only a limited range of radiation wavelengths, absorbing radiation outside this range. Interference filters reflect radiation at wavelengths lower and higher than the interval they transmit. Each type may be either a broad or a narrow bandpass filters. This is a graph distinguishing the two types.
Landsat Thematic Mapper Bands • Landsat collects monochrome images in each band by measuring radiance & reflectance in each channel • When viewed individually, these images appear as shades of gray
Earth Science Mission Profile1997-2003 eospso.gsfc.nasa.gov
Earth Science Mission Profile2004-2010 eospso.gsfc.nasa.gov
MODIS Onboard Calibrators Spectral Radiometric Calibration Assembly Solar Diffuser Blackbody Scan Mirror Space View Port Fold Mirror Nadir (+z) Calibration facility is part of sensor