Download
1 / 44
490 likes | 777 Vues
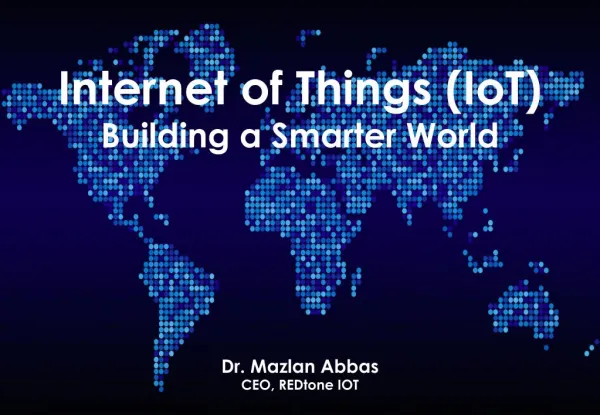
Guest Lecture on IOT for Taylor's University (April 15, 2015) - Things that are connected to the Internet can be smarter than you think. There can be embedded intelligence to the device but there are time, a higher processing power is required in the cloud. But when you aggregate various kinds of data from multiple sources, it will bring better insights that you might not have the ability to find out if its data resides in silos. To build smarter world, we need smarter people to make it work.

E N D
Internet of Things (IoT) Building a Smarter World Dr. Mazlan Abbas CEO, REDtone IOT Copyright © 2015 RIOT. All rights reserved “Connected Communi?es and Internet of Things: Bringing Value Through Visibility”, 10th Dec. 2014, Universi? Malaya
THE IOT MARKET THE UNTAPPED OPPORTUNITY Copyright © 2015 RIOT. All rights reserved
BY 2020, HOW MANY DEVICES WILL EXIST? Gartner 26 Billion Units Cisco 50 Billion Units 2020 Intel 200 Billion Units IDC 212 Billion Units Source: [1] http://www.gartner.com/newsroom/id/2684616 [2] http://www.intel.com/content/www/us/en/internet-of-things/infographics/guide-to-iot.html [3] http://share.cisco.com/internet-of-things.html [4] http://www.zdnet.com/article/internet-of-things-8-9-trillion-market-in-2020-212-billion-connected-things/ Copyright © 2015 RIOT. All rights reserved
WHAT WILL BE THE IOT MARKET SIZE $8.9 Trillion RMB 5-10 Trillion $14.4 Trillion China Market By 2020 - IDC 14,720 Jobs By 2022 - Cisco RM 9.8 Billion New Jobs in Malaysia Malaysia Market Sources: [1] http://www.businesswire.com/news/home/20131003005687/en/Internet-Poised-Change-IDC#.VKZdfHTMUuc [2] http://postscapes.com/internet-of-things-market-size [3] Gartner Market Databook 2014 & Frost & Sullivan [4] National IOT Strategic Blueprint Copyright © 2015 RIOT. All rights reserved
THE HISTORY OF INTERNET OF THINGS Copyright © 2015 RIOT. All rights reserved
Copyright © 2015 RIOT. All rights reserved
Copyright © 2015 RIOT. All rights reserved
Copyright © 2015 RIOT. All rights reserved
THE NEED TO CONNECT ASSETS/OBJECTS/THINGS Knowing our Assets – Typical Questions What is the condition of my goods. Where can I park? Who is a better and safer bus driver? When is my next train? How to reduce my electricity bill? Why my items are not selling? What IF we can connect ALL these assets and get the answers to ALL these questions? Copyright © 2015 RIOT. All rights reserved
WHAT ARE SMART, CONNECTED PRODUCTS (THINGS)? Physical Components - comprise the product’s mechanical and electrical parts. Smart Components - amplify the capabilities and value of the physical components Connectivity Components - amplifies the capabilities and value of the smart components and enables some of them to exist outside the physical product itself. Copyright © 2015 RIOT. All rights reserved
WHAT CAN SMART, CONNECTED THINGS DO? Control Monitoring Optimize Autonomy Copyright © 2015 RIOT. All rights reserved
IOT TRANSFORM OUR THINKING How value is created and captured? How the amount of new (and sensitive) data is utilized and managed? How relationships with traditional business partners such as channels are redefined? What roles companies should play as industry boundaries are expanded? Copyright © 2015 RIOT. All rights reserved
10/90 RULE – THE UNCONNECTED THINGS The Last 100 meter connectivity Connected World Still Disconnected The “last 100 meters” represent > 90% potential number of connections Today, the devices used in the “last 100 meters” are typically not connected. The wide-area network is to a larger extent connected e.g. through smartphones, home routers (e.g. ADSL routers) and GSM / 3G / 4G Routers. Copyright © 2015 RIOT. All rights reserved
Connected World Copyright © 2015 RIOT. All rights reserved
The IOT Enablers Copyright © 2015 RIOT. All rights reserved
Copyright © 2015 RIOT. All rights reserved
44x 2020 80% 35 zettabytes as much Data and Content Over Coming Decade Of world’s data is unstructured 2009 800,000 petabytes Copyright © 2015 RIOT. All rights reserved
OUR HYPOTHESIS SENSING-AS-A-SERVICE BUSINESS MODEL Copyright © 2015 RIOT. All rights reserved
WHAT IF – we can create Compound Applications across industries? Copyright © 2015 RIOT. All rights reserved
Connect Aggregate Derive Actionable Insights Data Fusion & Compound Applications Copyright © 2015 RIOT. All rights reserved
“Sensing-as-a-Service” by connecting, aggregating and deriving actionable insights” Network Applications Improved Performance Reduced Costs Create Innovative Products New Revenue Streams Visualizations Analytics With localized analytics With Social Media aggregated analytics IOT Platform Sensors and Sensor Owners (Personal, Private, Public & Commercial) Copyright © 2015 RIOT. All rights reserved
CHALLENGES – DATA OWNERSHIP Commercial Sensor Data Providers Organizations Personal and Households Private Public Business entities who deploy and manage sensors by themselves by keeping ownership. They earn by publishing the sensors and sensor data they own through sensor publishers. Public infrastructure such as bridges, roads, parks, etc. All the sensors deployed by the government will be published in the cloud depending on government policies. All personal items, such as mobile phones, wrist watches, spectacles, laptops, soft drinks, food items and household items, such as televisions, cameras, microwaves, washing machines, etc Private business organization has the right to take the decision whether to publish the sensors attached to those items to the cloud or not. [Source: “Sensing as a Service Model for Smart Cities Supported by Internet of Things”, Charith Perera et. al., Transactions on Emerging Telecommunications Technology, 2014] Copyright © 2015 RIOT. All rights reserved
THE GOLD RUSH MAKING SENSE OF SENSOR DATA … BUT WHAT DATA? Copyright © 2015 RIOT. All rights reserved
VALUE IS CREATED BY MAKING SENSE OF DATA More Important Evaluated understanding Wisdom Understanding WHY Appreciation of Less Answers to questions. HOW Knowledge Important Answers to questions WHERE WHEN WHO WHAT Information Data Symbols VALUE PYRAMID Copyright © 2015 RIOT. All rights reserved
LET’S START WITH A BLANK TEMPLATE Wisdom Understanding Knowledge Information Evaluated understanding Appreciation of “why” Answers to “how” questions V a l u e Answers to “who”, “what”, “where” and “when” questions Data Symbols Empty (0), Full (1) Who Benefits? – Determine the Stakeholders Copyright © 2015 RIOT. All rights reserved
EXAMPLE – SMART PARKING Wisdom Understanding Knowledge Information Evaluated understanding NA Appreciation of “why” Why this parking area is not fully occupied? Answers to “how” questions How to implement a tiered charging? How to find “overstayed” vehicles? V a l u e Answers to “who”, “what”, “where” and “when” questions Who park at this lot? What kind of vehicle? Where is the empty parking lot? When is the peak period? Empty (0), Full (1) Data Symbols Who Benefits? - Citizens / Parking Operators / City Council / Shops Copyright © 2015 RIOT. All rights reserved
IOT SOLVING SMART CITY ISSUES Smart Parking Smart Waste Management Smart Street Light Smart Public Transportation 1. Who is using the car park? 2. What is the status of the car park? 3. When was the car park used? 4. Where is the location of empty car park? 5. How far is the car park? 6. How much can we charge? 7. How to optimize the car park? 8. Why so many cars prefer a particular carp park? 9. Why my car park revenue is down? 1. Who is collecting the garbage? 2. What is the status of garbage bin? 3. When was the garbage collected? 4. Where is the location of full bins? 5. How to plan the route of the trucks? 6. How many days till the next collection? 7. How much garbage is produced in an area? 8. Why is the garbage truck not picking up garbage? 9. Why is a particular area producing more garbage? 1. Who is driving the bus? 2. What is the occupancy? 3. What is the bus condition? 4. What is the driving pattern? 5. When is the bus arriving? 6. Where is the location of the bus? 7. How to prolong the bus life? 8. How many busses to deploy on a route? 9. How best to hire drivers for the buses? 10. Why is the bus late? 11. Why is this bus has high maintenance? 1. Who triggered the lights? 2. What is the brightness of the light? 3. When were the lights switched on? 4. Where is the location of faulty light? 5. How bright should the lights be? 6. How long should the lights be on? 7. How busy is the road? 8. Why is the cost of maintenance high? Copyright © 2015 RIOT. All rights reserved
COMMERCIAL IOT SENSOR PROVIDER Gathering temperature, light, pressure, humidity and pollution. The street town council center would want the temperature and humidity data for planning during rough weather The city would pay for access to the light sensors in order to decide when to turn on and off the street lights The weather department would want the temperature and pressure data A university may want access to the pollution information for research purposes for a limited period Copyright © 2015 RIOT. All rights reserved
Environmental Monitoring Multiple Sensors Temperature CO Noise Car Presence • • • • Moisture temperature Humidity Pluviometer (rain gauge) Anemometer (wind-speed) • • • • Outdoor Parking Management Parking sensors Parks and Gardens Irrigation Sensors in green zones Ferromagnetic sensors • Smart City Mobile Environmental Monitoring Sensors installed in public vehicles Temperature CO Noise Car Presence • • • • Guidance to free parking lots Panels located at intersections Taking information retrieved by the deployed parking sensors in order to guide drivers towards the available free parking lots • Traffic Intensity Monitoring Devices located at main entrance of city Measure main traffic parameters • Traffic volumes • Road occupancy • Vehicle speed • • Copyright © 2015 RIOT. All rights reserved Queue Length
BENEFITS OF SENSING-AS-A-SERVICE Copyright © 2015 RIOT. All rights reserved
BENEFITS SENSING-AS-A-SERVICE Copyright © 2015 RIOT. All rights reserved
Harnessing the of the Application Developers Copyright © 2015 RIOT. All rights reserved
Participatory Sensing - “Rapid deployment” Copyright © 2015 RIOT. All rights reserved
Built-in Cloud Services – “Pay-per-Use” or “Subscription-based” Copyright © 2015 RIOT. All rights reserved
REUSE Copyright © 2015 RIOT. All rights reserved
Reduction of Data Acquisition Cost – “Sustainable Business Model” Copyright © 2015 RIOT. All rights reserved
Collect Data Previously Unavailable – “Assist scientific community or survey activities” Copyright © 2015 RIOT. All rights reserved
Getting Insights via Crowdsensing Copyright © 2015 RIOT. All rights reserved
SMARTPHONE AS YOUR “SENSING ASSISTANT” Sensors: • Camera – “Eyes” • Audio – “Ears” • Accelerometer – “Speed” • GPS – “Location” • Gyroscope – “Movement” • Compass – “Direction” • Proximity – “Closeness” • Ambient light – “Eyes” • Others… Crowdsourcing Via Crowdsensing Context 1. Spatial – Location / Speed Orientation 2. Temporal – Time / Duration 3. Environmental – Temperature / Light / Noise Level 4. User Characterization – Activity (Mobility Pattern) / Social (Friends, Interactions) 5. Resource Availability – Storage / Memory / Computational / Battery Copyright © 2015 RIOT. All rights reserved
NOISETUBE – POLLUTION DATA USING SMARTPHONES Local governments / city planners • Improved decision-making • Get immediate feedback and opinions from citizens • Give immediate feedback to citizens Citizens and Communities concerned with noise • Measure your daily sound exposure in dB(A) with your mobile phone • Tag noisy sources to inform the community about them • Visualize your measurements on a map and contribute to the creation of collective, city-wide noise maps • Compare your experience with that of others Researchers • Get access to and analyze (anonymized) collective noise data Developers • Extend mobile app in whichever way you see fit Copyright © 2015 RIOT. All rights reserved
Life-Logging The 150 Days of My Life Copyright © 2015 RIOT. All rights reserved
Copyright © 2015 RIOT. All rights reserved
Copyright © 2015 RIOT. All rights reserved
THANK YOU People wants to get connected too! Not only Things! People wants to get connected too! Not only Things! EMAIL: mazlan.abbas@redtone.com FACEBOOK: www.facebook.com/drmazlanabbas LINKEDIN: my.linkedin.com/in/mazlan/ SLIDESHARE: www.slideshare.net/mazlan1 TWITTER: mazlan_abbas about.me/mazlan.abbas Copyright © 2015 RIOT. All rights reserved