Simple Linear Regression Models: A Detailed Overview
Learn about deterministic and probabilistic relationships between variables in simple linear regression models. Explore how to estimate mean y-values and make predictions.


Simple Linear Regression Models: A Detailed Overview
E N D
Presentation Transcript
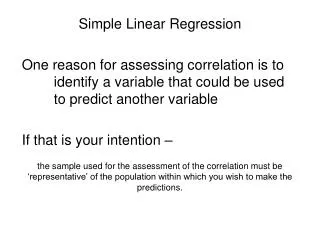
Simple Linear Regression Section 13.1
Deterministic Relationship • If the value of y (dependent) is completely determined by the value of x (Independent variable) • Most are not determined completely by another
Probabilistic Model • Description of the relation between 2 variables that are not deterministic. • It allows y to be larger or smaller than f(x) by a random amount, e. • Y = f(x) +e
Simple Linear Regression Model • Assumptions about the distribution of e • Mean • St. Dev. • Distribution of e at any x value is normal • Random deviations associated with different observations are independent of 1 another
Slope • Average change in y associated with a 1 unit increase in x. • Point estimate is b. • Y-intercept’s point estimate is a.
X* denotes a specified value of the predictor variable x …. • So has 2 different interpretations • It is a point estimate of the true mean y value when x = x*. • It is a point predictor of an individual y value that would be observed when x = x*.
Find the point estimate of the mean y-value for the following: So what’s the point estimate for an 18 year old mom?
Point estimate and point prediction are identical – only the interpretation is different. • Prediction – weight of single baby who mom is 18 • Estimate – average weight of all babies born to 18 year-olds
Answer the following: • Explain the slope in context of the problem • Explain the y-intercept in context of the problem.
Find SSResid. • on calculator – every time you calculate a linear regression – it calculates the residuals. Put them in list 3 and square them & add the list.
Point estimate of is • It represents the typical deviation in the y-variable from the least squares line.
Find the probability that a 19 year old mother has a baby that is more than 3000 g.
Coefficient of determination (r2) • It’s the amount of variation in the y-variables that can be explained by the least squares line.
Homework Worksheet