
Distributed Generation
E N D
Presentation Transcript
Distributed Generation Mohammad Amin Latifi Bureau of Privatization Ministry of Energy
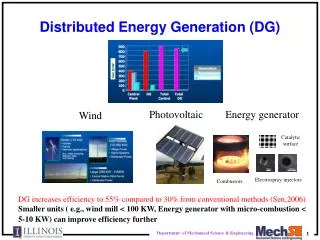
Future Trends of Electric Utility Industry Central Power Plants Distributed Energy Systems Photovoltaic Array Microturbine Wind Turbine Fuel Cell Combustion Gas Turbines Energy Storage Devices
Central Power Station Smart controller Regional Dispatch Transmission line Energy Value Information Communication Distribution Substation Gas turbines Micro-turbines Energy storage devices Distribution line Stand-alone Remote location Town Building Factory Hospital Electric Power Monitoring & Control Lines Operating System For DG Source: Distributed Utility Associates
Definition • Distributed Generation (DG) is the implementation of various power generating resources, near the site of need, either for reducing reliance on, or for feeding power directly into the grid. DG may also be used to increase transmission and distribution system reliability.
Technologies for DG • Technologies for Distributed Energy Systems (DG) • Gas technologies Combustion gas turbines • Micro-turbines • Fuel cells • Renewable Energy Technologies Biomass power Small wind turbines Photovoltaic Arrays
Applications for DG • Applications of DG • Stand-alone • Standby • Grid-interconnected • Peak shaving
Benefits of DG • Benefits of DG • Environmental-friendly and modular electric generation • Increased reliability • Fuel flexibility • Uninterruptible service • Cost savings • On-site generation • Standby Generation
Barriers of DG • Barriers • Technical Barriers Protective equipment Safety measures Reliability and power-quality concerns • Business-Practices Barriers Contractual and procedural requirements for interconnection Procedures for approving interconnection, application and interconnection fees, Insurance requirements Operational requirements • Regulatory Barriers Tariff structures applicable to customers Net metering Environmental permitting
What supports Technologies of DG? • What supports Technologies of DG? • Power Electronics Technologies Advanced Power Converter Design Technique High-speed/high-power/low-losses power switches New control techniques • Digital signal processors with high performance • New communications in the form of the Internet • Planning and valuation tools Value to grid Capacity needs assessment
Comparison of Several Technologies Source: Distributed Energy Resources and Resource Dynamics Corporation
Combustion Gas Turbines (1) fuel Power Turbine air Combustor Compressor Power Converter Generator HRSG (Heat Recovery Steam Generator) Feed water Process steam Fig. 1 Block diagram of Combustion Gas Turbine System.
Combustion Gas Turbines (2) • Features • Very mature technology • Size: 0.5 – 30+ MW • Efficiency: electricity (20 – 45%), cogeneration (80 – 90%) • Installed cost ($/kW): 400 – 1,200 • O&M cost ($/kWh): 0.003 – 0.008 • Fuel: natural gas, biogas, propane • Emission: approximately 150 – 300 ppm NOx (uncontrolled) below approximately 6 ppm NOx (controlled) • Cogeneration: yes (steam) • Commercial Status: widely available • Three main components: compressor, combustor, turbine • Start-up time range: 2 – 5 minutes • Natural gas pressure range: 160 – 610 psig • Nominal operating temperature: 59 F
Combustion Gas Turbines (3) • Advantages & Disadvantages • Advantages • High efficiency and low cost (particularly in large systems) • Readily available over a wide range of power output • Marketing and customer serving channels are well established • High power-to-weight ratio • Proven reliability and availability • Disadvantages Reduced efficiencies at part load Sensitivity to ambient conditions (temperature, altitude) Small system cost and efficiency not as good as larger systems
Micro-turbines (2) • Features • Size: 25 – 500 kW • Efficiency: unrecuperated (15%), recuperated (20 – 30%), with heat recovery (up to 85%) • Installed cost ($/kW): 1,200 – 1,700 • O&M cost ($/kWh): 0.005 – 0.016 • Fuel: natural gas, hydrogen, biogas, propane, diesel • Emission: below approximately 9 - 50 ppm NOx • Cogeneration: yes (50 – 80C water) • Commercial Status: small volume production, commercial prototypes now • Rotating speed: 90,000 – 120,000 • Maintenance interval: 5,000 – 8,000 hrs
Micro-turbines (3) • Advantages & Disadvantages • Advantages • Small number of moving parts • Compact size • Light-weight • Good efficiencies in cogeneration • Low emissions • Can utilize waste fuels • Long maintenance intervals • Disadvantages Low fuel to electricity efficiencies
Power Converter AC Power + Fuel Cathode Catalyst H2 Reformer O2 from air Anode Catalyst Polymer Electrolyte H2O Exhaust Fuel Cells (1) Electrochemical energy conversion:Hydrogen + Oxygen Electricity, Water, and Heat Fig. 3 Block diagram of Fuel Cell System. 18
Fuel Cells (3) • Features (2) • Size: 1 kW – 10 MW • Efficiency: electricity (30 – 60%), cogeneration (80 – 90%) • Installed cost ($/kW): 1,000 – 5,000 • O&M cost ($/kWh): 0.0019 – 0.0153 • Fuel: natural gas, hydrogen, propane, diesel • Emission: very low • Cogeneration: yes (hot water) • Commercial Status: PAFC: commercially available SOFC, MCFC, PEMFC: available in 2004
Nacelle Wind Gear Box Low-speed shaft High-speed shaft Generator Power Converter Wind Turbines (1) Fig. 4 Block diagram of Small Wind Turbine System.
Wind Turbines (2) • Features • Size: small (0.3 - 50 kW), large (300 kW – +5 MW) • Efficiency: 20 – 40% • Installed cost ($/kW): large-scale (900 - 1,100), small-scale (2,500 - 5,000) • O&M cost ($/kWh): 0.005 • Fuel: wind • Emission: zero • Other features: various types and sizes • Commercial Status: widely available • Wind speed: Large turbine: 6 m/s (13 mph) at average sites Small turbine: 4 m/s (9 mph) at average sites • Typical life of a wind turbine: 20 years
Wind Turbines (3) • Advantages & Disadvantages • Advantages • Power generated from wind farms can be inexpensive • Low cost energy • No harmful emissions • Minimal land use • : the land below each turbine can be used for animal grazing or farming • No fuel required • Disadvantages Variable power output due to the fluctuation in wind speed Location limited Visual impact : Aesthetic problem of placing them in higher population density areas Bird mortality
Photovoltaic Arrays (1) PV module Cell Array Charge Controller AC power DC power Power Converter Batteries Fig. 5 Block diagram of Photovoltaic Array System.
Photovoltaic Arrays (4) • Features (3) • Size: 0.3 kW – 2 MW • Efficiency: 5 – 15% • Installed cost ($/kW): 6,000 – 10,000 • O&M cost ($/kWh): 0.001 • Fuel: sunlight • Emission: zero • Main components: batteries, battery chargers, a backup generator, a controller • Other features: no moving parts, quiet operation, little maintenance • Commercial Status: commercially deployed • An individual photovoltaic cell: 1 – 2 watts
Photovoltaic Arrays (5) • Advantages & Disadvantages • Advantages • Work well for remote locations • Require very little maintenance • Environmentally friendly (No emissions) • Disadvantages Local weather patterns and sun conditions directly affect the potential of photovoltaic system. Some locations will not be able to use solar power
Energy Storage Technologies • Batteries • Capacitors • Flywheels • Superconducting Magnetic Energy Storage • Compressed air energy storage
Power Converter 3 AC 240/480 V 50 or 60 Hz Distributed Energy System Sensors Loads Trans. Vdc V, I, P, Q DSP Controller Different Configurations for DG 1. A Power Converter connected in a Stand-alone AC System (1) Fig. 6 Block diagram of a Power Converter connected in a stand-alone AC system.
I Load 3 AC 240/480 V 50 or 60 Hz E V Vdc Different Configurations for DG 1. A Power Converter connected in a Stand-alone AC System (2) Fig. 7 Simplified block diagram of Fig. 6.
Power Converter Utility Mains 3 AC 240/480 V 50 or 60 Hz Distributed Energy System Sensors Trans. Vdc Loads V, I, P, Q DSP Controller Different Configurations for DG 2. A Power Converter connected in Parallel with the Utility Mains (1) Fig. 8 Block diagram of a Power Converter connected in parallel with the utility mains.
Utility Mains I 3 AC 240/480 V 50 or 60 Hz E V Vdc Different Configurations for DG 2. A Power Converter connected in Parallel with the Utility Mains (2) Fig. 9 Simplified block diagram of Fig. 8.
Power Converters Sensors Micro-turbine Trans. 3 AC 240/480 V 50 or 60 Hz DSP Controller Loads V, I, P, Q Sensors Trans. Fuel Cell DSP Controller V, I, P, Q Different Configurations for DG 3. Paralleled-Connected Power Converters in a Stand-alone AC System (1) Fig. 10 Block diagram of Paralleled-Connected Power Converters in a Stand-alone AC System.
I1 I2 V V E E Vdc1 Vdc2 Loads Different Configurations for DG 3. Paralleled-Connected Power Converters in a Stand-alone AC System (2) Fig. 11 Simplified block diagram of Fig. 10.
Different Configurations for DG 4. Paralleled-Connected Power Converters with a common DC grid in a Stand-alone AC System (1) Power Converters Sensors Micro-turbine 3 AC 240/480 V 50 or 60 Hz V, I, P, Q DSP Controller Loads Sensors Fuel Cell V, I, P, Q DSP Controller DC Grid Fig. 12 Block diagram of Paralleled-Connected Power Converters with a common DC grid in a Stand-alone AC System.
DC Grid I1 E 3 AC 240/480 V 50 or 60 Hz Vdc Loads I2 E Different Configurations for DG 4. Paralleled-Connected Power Converters with a common DC grid in a Stand-alone AC System (2) Fig. 13 Simplified block diagram of Fig. 12.
Schematics of an average European electricity grid and connection levels for DG and RES
DG Network Connection Issues • Impact on power system operation (changing power flows, voltage profile, uncertainty in power production and etc) • Voltage regulation • Power losses • Power quality (Sags, swells and etc ) • Harmonics • Short circuit levels • Location and size of DG • Safety and protection consideration
Data needed to evaluate the DG impact • Size rating of the proposed DR • Type of DR power converter (static or rotating machine) • Type of DR prime energy source (such photovoltaic, wind or fuel cell • Operating cycles • Fault current contribution of DR • Harmonics output content of DR • DR power factor under various operating conditions • Location of DR on the distribution systems • Locations and setting of voltage regulation equipment on distribution system • Locations and settings of equipment for over current protection on distribution system
Distributed Generation (DG) Share of Total Generation Capacity (2007)
What is CHP? • Integrated System • Provides a Portion of the Electrical Load • Utilizes the Thermal Energy • Cooling • Heating
Improved Reliability Lower Energy Costs Lower Emissions (including CO2) Conserve Natural Resources Support Grid Infrastructure Fewer T&D Constraints Defer Costly Grid Upgrades Price Stability Facilitates Deployment of New Clean Energy Technologies Benefitsof CHPHigh Efficiency, On-Site Generation Means
Factors for CHP Suitability • High Thermal Loads-(Cooling, Heating) • Cost of buying electric power from the grid versus to cost of natural gas (Spark Spread) • Long operating hours (> 3000 hr/yr) • Need for high power quality and reliability • Large size building/facility • Access to Fuels (Natural Gas or Byproducts)
Induction • Requires Grid Power Source to Operate • When Grid Goes Down, CHP System Goes Down • Less Complicated & Less Costly to Interconnect • Preferred by Utilities Synchronous • Self Excited (Does Not Need Grid to Operate) • CHP System can Continue to Operate thru Grid Outages • More Complicated & Costly to Interconnect (Safety) • Preferred by Customers GeneratorsTwo Types of Generators