Download
1 / 39
410 likes | 507 Vues
Understand the classifications of monitors, choose between hardware and software options, and overcome design challenges in monitoring systems efficiently. Explore activation mechanisms, buffer optimization, data compression, and more. Learn about measuring software through code instrumentation and various monitoring methods.

E N D
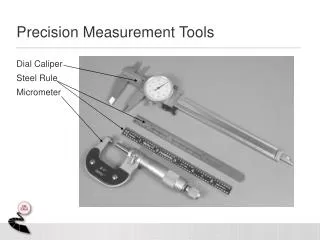
Measurement Tools Andy Wang CIS 5930 Computer Systems Performance Analysis
Monitors • A monitor is a tool used to observe system activity • Proper use of monitors is key to performance analysis • Also useful for other system observation purposes
Classifications of Monitors • Hardware vs. software monitors • Event-driven vs. sampling monitors • Online vs. batch monitors
HW vs. SW Monitors • HW monitors used primarily by HW designers • Requires substantial knowledge of HW details • VLSI limits monitoring possibilities • Software monitors used (mostly) by everyone else
Event-Driven vs. Sampling Monitors • Event-driven monitors notice every time a particular type of event occurs • Ideal for rare events • Require low per-invocation overheads • Sampling monitors check the state of the system periodically • Good for frequent events • Can afford higher overheads
Online vs. Batch Monitors • Online monitors can display info continuously • Or, at least, frequently • Batch monitors save it for later • Usually have separate analysis procedures
Issues in Monitor Design • Activation mechanism • Buffer issues • Data compression/analysis • Enabling/disabling monitors • Priority issues • Abnormal events monitoring
Activation Mechanism • When do you collect the data? • When an interesting event occurs, trap to data collection routine • E.g., make_request(), request_complete() • Need to watch out for asynchronous calls • Analyze every step taken by system • Can slow down the system significantly • Go to data collection routine when timer expires
Buffer Issues • Buffer size • Big enough to avoid frequent disk writes • Small enough to make disk writes cheap • Number of buffers • At least two (one to fill up, one to record) • Buffer overflow • Overwrite old data you haven’t recorded • Or lose new data you don’t have room for • In either case, count what’s lost • Sometimes can wait for buffer to empty
Data Compressionor Analysis • Data can be literally compressed • Or can be reduced to a summary form • Both methods save space for holding data • But at cost of extra overhead in gathering it • Sometimes can use idle time to compress • But maybe better spent dumping data to disk
Enabling/Disabling Monitors • Most system monitors have some overhead • Can cause system to fail due to resource contension • Need to turn them off if high performance required • Unless overhead is trivial • Or if system is designed for gathering data • As with many research systems
Priority of Monitor • How high a priority for monitor’s operations? • Trade off performance impact against timely & complete data gathering • Not always simple question
Monitoring Abnormal Events • Often, knowing about failures and errors more important than knowing about normal operation • Sometimes requires special attention • System may not be operating very well at time of failure!
Tools and Methods For Software Measurement • OK, so how do I actually measure a piece of software? • What practical tools and methods are available to me? • How do I get my project done?
Tools ForSoftware Measurement • Code instrumentation • Tracing packages • System-provided metrics and utilities • Profiling
Code Instrumentation • Adding monitoring code to system under study • Basically, just add code that does what you want
Advantages ofCode Instrumentation • Usually most direct way to gather data • Complete flexibility in where to insert monitoring code • Strong control over costs of monitoring • Resulting measurements always available
Disadvantages of Instrumenting Code • Requires access to source • Requires strong knowledge of design and details of code • Watch out for asynchronous calls • Requires recompilation to change monitoring facility • If overdone, strong potential to affect performance • May be hard to port to different OS ver.
Typical Types of Instrumentation • Counters + Cheap and fast • Low level of detail • Need to watch out for multicore contention • Logs + More detail and cost • Require occasional dumping or digesting • Timers +To determine elapsed time for operations • Typically using OS-provided system calls
Counters • Useful only if number of times an event occurs is of interest • Can be used to accumulate totals • In modern systems, make them wide enough to not overflow (long long is good)
Counter Examples • Number of times a network protocol transmits packets • Number of times programs are swapped out due to exceeding time slices • Number of incoming requests to Web server
Logs • Can log complex data about an event • But take more space • Typically, log data into reserved buffer • When full, ask that buffer be written to disk • Often want second buffer to gather data while awaiting disk write
Designing a Log Entry • What form should a log entry take? • Designing for compactness vs. human readability • Former better for most purposes • Easy to post-format for printing • Latter useful for system debugging • Make sure no important information is lost in compacting log entry
Designing a Log Entry • Shouldinclude • A version stamp • Delimiters and checksum
Timers • Many OSes provide system calls that start and stop timers • Allows measuring how long things took • Usually, only elapsed time measurable • Not necessarily time spent running particular process • Care required to capture real meaning of timings
Tracing Packages • Allow dynamic monitoring of code that doesn’t have built-in monitors • Basically, augment code to call monitoring routines when desired • Akin to debuggers • Typically allow counters and some forms of logging
Advantagesof Tracing Packages • Allows pretty arbitrary insertion of monitoring code • Don’t need recompilation to instrument code • Tremendous flexibility at measurement time • No instrumentation overhead when you’re not using it
Disadvantagesof Tracing Packages • Somewhat higher overheads than building instrumentation into code • Usually requires access to source for effective use • Usually requires deep understanding of code internals • Only produces data when special package used • Usually specific to particular systems
How Do Tracing Packages Work? • Much like debuggers - • Attach to running programs • Use commands in tracing packages to associate data gathering with particular points in the programs • Replace normal code at that point in program with calls to data-gathering code
System-ProvidedMetrics and Utilities • Many OSes provide users access to some metrics • Most OSes also keep some form of accounting logs • Lots of info can be gathered this way
What a Typical System Provides • Timing tools • Process-state tools • System-state tools • OS accounting logs • Logs for important system programs
Timing Tools • Tools that time execution of a process • Several different times often provided • E.g., Unix time command gives system, user, and elapsed time • User time: time spent in user mode • System time: CPU time spent for the kernel process • Elapsed time: wall clock time • User + system can be greater than elapsed for multicore systems
Timing Tools • Some components of times provided may depend on other system activities • Just calling time on a command may not tell the whole story
Process-State Tools • Many systems have ways for users to learn state of their processes • Typically provide information about • Time spent running process so far • Size of process • Status of process • Priority of process • I/O history of process
Using Process-State Tools • Typically can’t monitor process state continuously • Updates not provided every time things change • Can get snapshots on demand • Most useful for sampling monitors
System-State Tools • Many systems allow some users to examine internal state • E.g., virtual memory statistics • Length of various queues • Often available only to privileged users • Typically, understanding state requires substantial expertise • Often useful only for specific purposes
OS Accounting Logs • Many OSes maintain logs of significant events • Based on either event-driven or sampling monitors • Examples: • Logins • Quota violations • Program executions • Device failures
System SoftwareAccounting Logs • Often, non-OS systems programs keep logs • E.g., mail programs • Usually only useful for monitoring those programs • But sometimes can provide indirect information • E.g., notice of failure to open connection to name server may indicate network failure