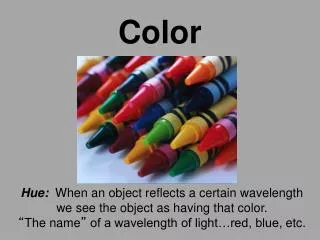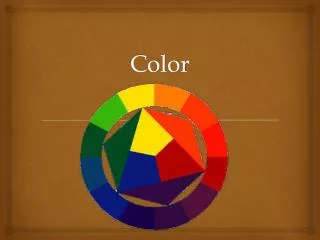
Color
Color. Computational Photography MIT Feb. 14, 2006 Bill Freeman and Fredo Durand. Why does a visual system need color?. http://www.hobbylinc.com/gr/pll/pll5019.jpg. Why does a visual system need color? (an incomplete list…). To tell what food is edible.

Color
E N D
Presentation Transcript
Color Computational Photography MIT Feb. 14, 2006 Bill Freeman and Fredo Durand
Why does a visual system need color? http://www.hobbylinc.com/gr/pll/pll5019.jpg
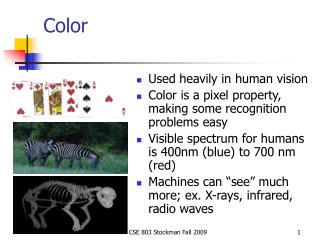
Why does a visual system need color?(an incomplete list…) • To tell what food is edible. • To distinguish material changes from shading changes. • To group parts of one object together in a scene. • To find people’s skin. • Check whether a person’s appearance looks normal/healthy. • To compress images
Lecture outline • Color physics. • Color representation and matching.
Spectral colors http://hyperphysics.phy-astr.gsu.edu/hbase/vision/specol.html#c2
Horn, 1986 Radiometry for color Spectral radiance: power in a specified direction, per unit area, per unit solid angle, per unit wavelength Spectral irradiance: incident power per unit area, per unit wavelength
Simplified rendering models: reflectance Often are more interested in relative spectral composition than in overall intensity, so the spectral BRDF computation simplifies a wavelength-by-wavelength multiplication of relative energies. = .* Foundations of Vision, by Brian Wandell, Sinauer Assoc., 1995
Simplified rendering models: transmittance = .* Foundations of Vision, by Brian Wandell, Sinauer Assoc., 1995
(just like Newton’s diagram…) Foundations of Vision, by Brian Wandell, Sinauer Assoc., 1995 How measure those spectra: Spectrophotometer
Two illumination spectra Blue sky Tungsten light bulb Foundations of Vision, by Brian Wandell, Sinauer Assoc., 1995
Some reflectance spectra Spectral albedoes for several different leaves, with color names attached. Notice that different colours typically have different spectral albedo, but that different spectral albedoes may result in the same perceived color (compare the two whites). Spectral albedoes are typically quite smooth functions. Measurements by E.Koivisto. Forsyth, 2002
400 500 600 700 nm 400 500 600 700 nm 400 500 600 700 nm 400 500 600 700 nm 400 500 600 700 nm 400 500 600 700 nm Color names for cartoon spectra cyan red green magenta yellow blue
400 500 600 700 nm 400 500 600 700 nm 400 500 600 700 nm yellow Yellow! Additive color mixing When colors combine by adding the color spectra. Example color displays that follow this mixing rule: CRT phosphors, multiple projectors aimed at a screen, Polachrome slide film. red green Red and green make…
400 500 600 700 nm 400 500 600 700 nm 400 500 600 700 nm green Green! Subtractive color mixing When colors combine by multiplying the color spectra. Examples that follow this mixing rule: most photographic films, paint, cascaded optical filters, crayons. cyan yellow Cyan and yellow (in crayons, called “blue” and yellow) make…
Overhead projector demo • Subtractive color mixing
How to find a linear model for color spectra: --form a matrix, D, of measured spectra, 1 spectrum per column. --[u, s, v] = svd(D) satisfies D = u*s*v‘ --the first n columns of u give the best (least-squares optimal) n-dimensional linear bases for the data, D: Low-dimensional models for color spectra
Basis functions for Macbeth color checker Foundations of Vision, by Brian Wandell, Sinauer Assoc., 1995
n-dimensional linear models for color spectra n = 3 n = 2 n = 1 Foundations of Vision, by Brian Wandell, Sinauer Assoc., 1995
n-dimensional linear models for color spectra n = 3 n = 2 n = 1 Foundations of Vision, by Brian Wandell, Sinauer Assoc., 1995
n-dimensional linear models for color spectra n = 3 n = 2 n = 1 Foundations of Vision, by Brian Wandell, Sinauer Assoc., 1995
Outline • Color physics. • Color representation and matching.
Accurate color reproduction is commercially valuable Many products are identified by color (“golden” arches); Few color names are widely recognized by English speakers - About 10; other languages have fewer/more, but not many more. It’s common to disagree on appropriate color names. Color reproduction problems increased by prevalence of digital imaging - eg. digital libraries of art. How do we ensure that everyone sees the same color? Why specify color numerically? Forsyth & Ponce
An assumption that sneaks in here • For now we will assume that the spectrum of the light arriving at your eye completely determines the perceived color. • But we know color appearance really depends on: • The illumination • Your eye’s adaptation level • The colors and scene interpretation surrounding the observed color.
Color matching experiment Foundations of Vision, by Brian Wandell, Sinauer Assoc., 1995
Color matching experiment 1 p1 p2 p3
Color matching experiment 1 p1 p2 p3
The primary color amounts needed for a match Color matching experiment 1 p1 p2 p3
Color matching experiment 2 p1 p2 p3
Color matching experiment 2 p1 p2 p3
p1 p2 p3 Color matching experiment 2 The primary color amounts needed for a match: We say a “negative” amount of p2 was needed to make the match, because we added it to the test color’s side. p1 p2 p3 p1 p2 p3
Foundations of Vision, by Brian Wandell, Sinauer Assoc., 1995
Grassman’s Laws • For color matches: • symmetry: U=V <=>V=U • transitivity: U=V and V=W => U=W • proportionality: U=V <=> tU=tV • additivity: if any two (or more) of the statements U=V, W=X, (U+W)=(V+X) are true, then so is the third • These statements are as true as any biological law. They mean that additive color matching is linear. Forsyth & Ponce
Measure color by color-matching paradigm • Pick a set of 3 primary color lights. • Find the amounts of each primary, e1, e2, e3, needed to match some spectral signal, t. • Those amounts, e1, e2, e3, describe the color of t. If you have some other spectral signal, s, and s matches t perceptually, then e1, e2, e3 will also match s, by Grassman’s laws. • Why this is useful—it lets us: • Predict the color of a new spectral signal • Translate to representations using other primary lights.
Goal: compute the color match for any color signal for any set of primary colors • Examples of why you’d want to do that: • Want to paint a carton of Kodak film with the Kodak yellow color. • Want to match skin color of a person in a photograph printed on an ink jet printer to their true skin color. • Want the colors in the world, on a monitor, and in a print format to all look the same.
How to compute the color match for any color signal for any set of primary colors • Pick a set of primaries, • Measure the amount of each primary, needed to match a monochromatic light, at each spectral wavelength (pick some spectral step size). These are called the color matching functions.
p1 = 645.2 nm p2 = 525.3 nm p3 = 444.4 nm Color matching functions for a particular set of monochromatic primaries Foundations of Vision, by Brian Wandell, Sinauer Assoc., 1995
We know that a monochromatic light of wavelength will be matched by the amounts of each primary. And any spectral signal can be thought of as a linear combination of very many monochromatic lights, with the linear coefficient given by the spectral power at each wavelength. Using the color matching functions to predict the primary match to a new spectral signal
Store the color matching functions in the rows of the matrix, C Let the new spectral signal be described by the vector t. Using the color matching functions to predict the primary match to a new spectral signal Then the amounts of each primary needed to match t are:
Internal review • So, for any set of primary colors, if we are given the spectral color matching functions for a set of primary lights • We can calculate the amounts of each primary needed to give a perceptual match to any spectral signal.
Suppose you use one set of primaries and I use another? • We address this in 2 ways: • Learn how to translate between primaries • Standardize on a few sets of favored primaries.
p1 = (0 0 0 0 0… 0 1 0)T p2 = (0 0 … 0 1 0 ...0 0)T p3 = (0 1 0 0 … 0 0 0 0)T p’1 = (0 0.2 0.3 4.5 7 …. 2.1)T p’2 = (0.1 0.44 2.1 … 0.3 0)T p’3 = (1.2 1.7 1.6 …. 0 0)T Primary spectra, P Color matching functions, C Primary spectra, P’ Color matching functions, C’ Any input spectrum, t The amount of each primary in P needed to match the color with spectrum t. The amount of each P’ primary needed to match t The spectrum of a perceptual match to t, made using the primaries P’ The color of that match to t, described by the primaries, P. How do you translate colors between different systems of primaries?
The values of the 3 primaries, in the unprimed system The values of the 3 primaries, in the primed system C P’ a 3x3 matrix P’ are the old primaries C are the new primaries’ color matching functions So, how to translate from the color in one set of primaries to that in another: