Chapter 3: Solid Materials
Chapter 3: Solid Materials. Iron is taken from the earth and copper is smelted from ore. Man puts an end to the darkness; he searches the farthest recesses for ore in the darkness. The Bible (Job 28:2-3). Image: Iron flows from a blast furnace. Source: American Iron and Steel Institute.

Chapter 3: Solid Materials
E N D
Presentation Transcript
Chapter 3: Solid Materials Iron is taken from the earth and copper is smelted from ore. Man puts an end to the darkness; he searches the farthest recesses for ore in the darkness. The Bible (Job 28:2-3) Image: Iron flows from a blast furnace. Source: American Iron and Steel Institute.
Ductile Tension Test Specimens Figure 3.1 Ductile material from a standard tensile test apparatus. (a) Necking; (b) failure. text reference: Figure 3.1, page 90
Brittle Tension Test Specimen Figure 3.2 Failure of a brittle material from a standard tesile test apparatus. text reference: Figure 3.2, page 91
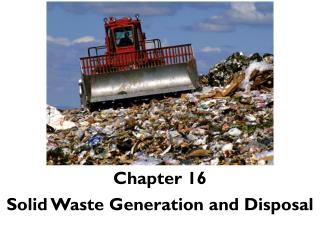
Strength/Density Comparison Figure 3.3 Strength/density for various materials. text reference: Figure 3.3, page 94
Fiber Reinforced Composite Figure 3.4 Cross section of fiber reinforced composite material. text reference: Figure 3.4, page 95
Ductile - diagram Figure 3.5 Stress-strain diagram for a ductile material. text reference: Figure 3.5, , page 96
Yield Strength Definition Figure 3.6 Typical stress-strain behavior for ductile metal showing elastic and plastic deformations and yield strength Sy. text reference: Figure 3.6, page 97
Brittle and Ductile Metal Comparison Figure 3.7 Typical tensile stress-strain diagrams for brittle and ductile metals loaded to fracture. text reference: Figure 3.7, page 98
Stress-Strain Diagram for a Ceramic Figure 3.8 Stress-strain diagram for a ceramic in tension and in compression. text reference: Figure 3.8, page 99
Composite Bar Figure 3.9 Bending strength of bar used in Example 3.6. text reference: Figure 3.9, page 100
Stress-Strain Diagram for Polymers Figure 3.10 Stress-strain diagram for polymer below, at, and above its glass transition temperature Tg. text reference: Figure 3.10, page 101
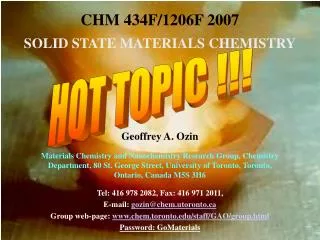
Density of Various Materials Figure 3.11 Density for various metals, polymers and ceramics at room temperature (20°C, 68°F) [From ESDU (1984)]. text reference: Figure 3.11, page 102
Density for Various Materials Table 3.1 Density for various metals, polymers, and ceramics at room temperature (20°C; 68°F). [From ESDU (1984)] text reference: Table 3.1, page 103
Elastic Modulus for Various Materials Figure 3.12 Modulus of elasticity for various metals, polymers, and ceramics at room temperature (20°C, 68°F) [From ESDU (1984)]. text reference: Figure 3.12, page 105
Elastic Modulus for Various Materials Figure 3.12 Modulus of elasticity for various metals, polymers, and ceramics at room temperature (20°C; 68°F). [From ESDU (1984)] text reference: Table 3.2, page 106
Poisson’s Ratio for Various Materials Table 3.3 Poisson’s ratio for various metals, polymers, and ceramics at room temperature (20°C; 68°F). [From ESDU (1984)] text reference: Table 3.3, page 107
Thermal Condictivity for Various Materials Figure 3.13 Thermal conductivity for various metals, polymers, and ceramics at room temperature (20°C, 68°F). [From ESDU (1984)]. text reference: Figure 3.13, page 113
Thermal Conductivity for Various Materials Table 3.4 Thermal conductivity for various metals, polymers, and ceramics at room temperature (20°C; 68°F). [From ESDU(1984)] text reference: Table 3.4, page 114
Thermal Expansion Coefficient for Various Materials Figure 3.14 Linear thermal expansion coefficient for various metals, polymers, and ceramics applied over temperature range 20 to 200°C (68 to 392°F) [From ESDU (1984)]. text reference: Figure 3.14, page 115
Linear Thermal Expansion Coefficient for Various Materials Table 3.5 Linear thermal expansion coefficient for various metals, polymers and ceramics at room temperature (20°C; 68°F). [From ESDU (1984)] text reference: Table 3.5, page 116
Specfic Heat Capacity for Various Materials Figure 3.15 Specific heat capacity for various metals, polymers, and ceramics at room temperature (20°C; 68°F) [From ESDU (1984)]. text reference: Figure 3.15, page 117
Specific Heat Capacity for Various Materials Table 3.6 Specific heat capacity for various metals, polymer, and ceramics at room temperature (20°C; 68°F). [From ESDU (1984)] text reference: Table 3.6, page 118
Rigid Beam Assembly Figure 3.16 Rigid beam assembly used in Example 3.12. text reference: Figure 3.16, page 120
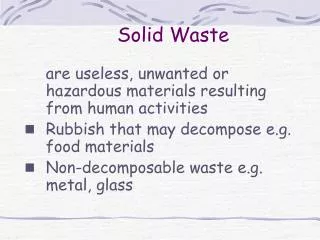
Elastic Modulus vs. Density Figure 3.17 Modulus of Elasticity plotted against density. The heavy envelopes enclose data for a given class of material. The diagonal contours show the longitudinal wave velocity. The guidelines of constant E/, E1/2/ , and E1/3/ allow selection of materials for minimum weight, deflection-limited design. [From Ashby (1992)]. text reference: Figure 3.17, page 122
Material Classes Table 3.7 Material classes and members and short names of each member. [From Ashby (1992)]. text reference: Table 3.7, page 123
Material Classes (cont.) Table 3.7 Material classes and members and short names of each member. [From Ashby (1992)]. text reference: Table 3.7, page 123
Strength vs. Density Figure 3.18 Strength plotted against density (yield strength for metals and polymers, compressive strength for ceramics, tear strength for elastomers, and tensile strength for composites). The guidelines of S/, S2/3/, and S1/2/ allow selection of materials for minimum-weight, yield-limited design. [From Ashby (1992)]. text reference: Figure 3.18, page 125
Elastic Modulus vs. Strength Figure 3.19 Modulus of elasticity plotted against strength. The design guidelines help with the selection of materials for such machine elements as springs, knife-edges, diaphragms, and hinges. [From Ashby (1992)]. text reference: Figure 3.19, page 127
Wear Constant vs. Limiting Pressure Figure 3.20 Archard wear constant plotted against limiting pressure. [From Ashby (1992)]. text reference: Figure 3.20, page 129
Elastic Modulus vs. Cost x Density Figure 3.21 Modulus of elasticity plotted against cost times density. The reference lines help with selection of materials for machine elements. [From Ashby (1992)]. text reference: Figure 3.21, page 131