Download
1 / 13
130 likes | 261 Vues
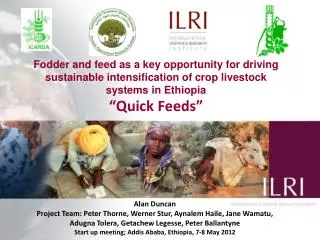
Water Related Indicators for Sustainable Crop-Livestock Intensification Planning in Ethiopia: ‘Quick-Water ’.

E N D
Water Related Indicators for Sustainable Crop-Livestock Intensification Planning in Ethiopia: ‘Quick-Water’
Objective: to provide a tool which can be used to support the spatial targeting of agricultural intensification practices to areas where the biophysical and livelihood conditions are likely to sustain long term development. Water is the entry point. Project scopeand limitations: proof of concept/demonstration of what is possible; short term project with limited time/resources Team: Economist/policy – Gebre; Crop specialist – Teklu; Livestock – Amare; Water – Charlotte; Spatial – Catherine/Yenenesh/An/Abisalom; Simon Process: identification of trajectories and indicators; consultation with line agencies at regional/national level; incorporation of feedback in product development Development of simple tool which produces national maps of selected trajectories and targets
Some key challenges to making intensification sustainable: • Do agricultural intensification initiatives account for water centered issues? (from MERET to AgWATER) • Is there consistency across different initiatives / policies locally and nationally? • Are the indicators for agricultural intensification planning strategies based on local and global experience? • Are ongoing intensification efforts embedded in the livelihood of local communities?
Identifying Development Trajectories for Ethiopia: Process Principles
Description and reason for selection of indicators / proxies
Transforming indicators into maps For each indicator spatial data (geographical layer) is identified 1 indicator = 1 map => Mapping tool box
Mapping toolbox • Combines indicator maps into trajectories • Livelihood scale • Units of observation are livelihood zones • Links trajectories to livelihoods • FEWSNET livelihood zone map (180 zones): Areas within which households (on average) share similar livelihood patterns i.e. they have access to the same set of food and cash income sources and to the same markets
The mapping toolbox Indicator 3 (I3) Indicator 1 (I1) Indicator 2 (I2) Trajectories Excel sheet I2zj> x2 I3zj> x3 I1zj> x1 Suitable livelihood zone for a given intensification trajectory Spatial processing Aggregates indicator maps to livelihood maps (by zonal statistic) Selects livelihood zones where all of conditions of the indicators are met Arc GIS
Areas with potential for multiple combinations of livelihood trajectories