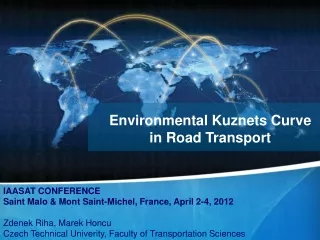
Environmental Kuznets Curve
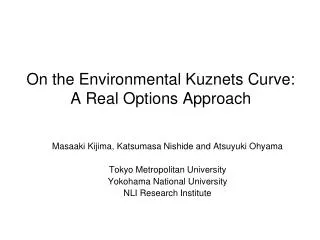
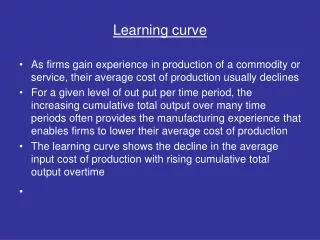
Environmental Kuznets Curve. Public Opinion & Input Politics Johan Rock & Henrik Werenskiold. EKC Theory . The relationship between environmental degradation and economical growth (GDP per capita) can be represented as an inverted U-shaped curve: . Stern’s Regression Model (2003).

Environmental Kuznets Curve
E N D
Presentation Transcript
Environmental Kuznets Curve Public Opinion & Input Politics Johan Rock & HenrikWerenskiold
EKC Theory • The relationship between environmental degradation and economical growth (GDP per capita) can be represented as an inverted U-shaped curve:
Stern’s Regression Model (2003) lnE/Pit= i + yi + 1 lnGDP/Pit + 2 lnGDP/P2it + it P = population i = country t = time • There may be an inverted U-shaped relation between urban ambient concentrations of some pollutants and income though this should be tested with more rigorous time series or panel data methods. (2003) • Will this inverted U-shaped relation be stronger in democracies than authoritarian regimes?
OurRegressionModel lnE/Pit= i+ yi + (dg + 1 lnGDP/Pit + (dg2 +2 lnGDP/P2it + control variable + it P = population i = country t = time d = democracy/ non-democracy dummy variable • A dummy variable for democracy has been added to the regression model in order to investigate whether there is a distinction between democracies and non-democracies • Is it possible to use a democracy index instead of dummy variable? • Is it feasible to use oil production as a control variable?
Mechanisms of the EKC • Transition from industrial to a service orientated economy. • Export of polluting industrial processes abroad. • Technological advances, generating less pollution • Higher awareness about the detrimental effects of pollution among voters. • Can the analysis confirm this? • MV preferences
Data • Same data as used in theSterninvestigationfocusingonsulphurdioxide (SO2) concentrations in urban areas. i = 40 countries t = 40 years • Collecting data from World Value Survey (WVS)
Critique • Non-democracy – data onemissions is more likely to be difficult to find and onewould have to questionitsvalidity. • Non-democraciesgenerallytend to be less affluentthandemocracies. Thereforewequestionwhetherauthoritariancountriesarerichenough to be included in thestudy. • The robustnessofthe EKC curveitself has beenquestioned by researchers.