Download
1 / 39
390 likes | 491 Vues
Explore the relationship between short-run and long-run supply, impact on inflation, recession, and unemployment. Learn about tax rates and revenues influence, short vs. long run equilibrium, and handling inflation. Empirical data on inflation-unemployment dynamics.

E N D
15 Extending the Analysis of Aggregate Supply
Chapter Objectives • The Relationship Between Short-Run Aggregate Supply and Long-Run Aggregate Supply • Applying the Extended AD-AS Model to Inflation, Recessions, and Unemployment • The Short-Run Tradeoff Between Inflation and Unemployment (Phillips Curve) • Why There is No Long-Run Tradeoff Between Inflation and Unemployment • Relationship Between Tax Rates, Tax Revenues, and Aggregate Supply
From Short Run To Long Run • Short Run • Long Run • Short-Run Aggregate Supply • Long-Run Aggregate Supply Graphically
From Short Run to Long Run • Short run – period in which nominal wages do not respond to price-level changes • Why: • 1. workers not immediately aware of effects of inflation on real wages • 2. many employees hired under fixed-wage contracts • Long run – period in which nominal wages are fully responsive to previous changes in price level
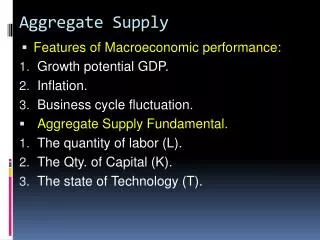
Short Run Aggregate Supply (SRAS) and Long Run Aggregate Supply (LRAS) SRAS is downward sloping –See figure 15.1a LRAS is vertical at the full employment output
From Short Run To Long Run Short-Run Aggregate Supply Long-Run Aggregate Supply AS1 ASLR AS2 AS1 a2 a2 AS3 b1 P2 P2 Price Level Price Level a1 a1 P1 P1 a3 a3 P3 P3 c1 Q3 Qf Qf Q2 Real Domestic Output Real Domestic Output
Long-Run Equilibrium in the AS-AD Model • See Figure 15.2 • In short run, equilibrium occurs where SRAS and AD curves intersect • in long run, equilibrium occurs where AD, SRAS, and LRAS curves intersect
G 15.1 From Short Run To Long Run Equilibrium in the Extended AD-AS Model ASLR AS1 Price Level a P1 AD1 Qf Real Domestic Output
Applying the Extended AD-AS Model • Demand Pull Inflation in the AD-AS Model: • Demand pull inflation occurs when AD increases pull up price level (rightward shift of AD curve) • In LR, SRAS curve will shift left, restoring LR equilibrium, but at a higher price level
From Short Run To Long Run Demand-Pull Inflation in the Extended AD-AS Model AS2 ASLR AS1 b P3 c P2 Price Level a P1 AD2 AD1 Qf Real Domestic Output
Cost-Push Inflation in the AD-AS Model • Cost-push inflation is caused by leftward shift of AS curve • This causes a policy dilemma: • 1. trying to maintain full employment (increase AD) will worsen inflation • 2. if gov takes hands off approach, recession will occur
From Short Run To Long Run Cost-Push Inflation in the Extended AD-AS Model If Government Counters Recession With Spending… If Government Ignores Recession… AS2 ASLR AS1 c P3 b P2 Price Level a P1 AD2 AD1 Qf Real Domestic Output
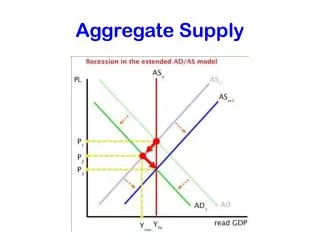
Recession and the Extended AD-AS Model • Application is controversial when recession caused by decreases in AD • Decline in price level affects wages, eventually nominal wages fall and AS curve shifts right • These changes may come only after lengthy recession, many economists recommend active monetary and fiscal policy
From Short Run To Long Run Recession in the Extended AD-AS Model AS1 ASLR AS2 a P1 b P2 Price Level c P3 AD1 AD2 Q1 Qf Real Domestic Output
The Inflation-Unemployment Relationship • 3 generalizations: • 1. short-run tradeoff b/w rate of unempl and rate in inflation • 2. AS shocks can cause BOTH higher rates of inflation and higher rates of unempl • 3. no significant tradeoff b/w inflation and unemployment over long periods of time
The Phillips Curve • Named after A.W. Phillips, GB • Curve used to demonstrate the short-run tradeoff b/w rate of inflation and rate of unemployment • Inverse relationship b/w the two • Can use AS AD model to determine this (See Figure 15.7)
The Inflation-Unemployment Relationship The Short-Run Effect of Changes on Real Output and the Price Level AS P3 Price Level P2 AD3 P1 AD2 P0 AD1 AD0 0 Q0 Q1 Q2 Q3 Real Domestic Output
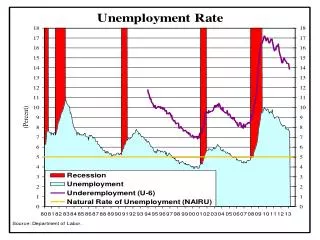
O 15.1 Annual Rate of Inflation (Percent) Annual Rate of Inflation (Percent) Unemployment Rate (Percent) Unemployment Rate (Percent) The Inflation-Unemployment Relationship • The Phillips Curve • Inverse Relationship • Inflation and Unemployment Concept Empirical Data Data for the 1960s 69 68 66 67 65 63 62 61 64
The Inflation-Unemployment Relationship • Adverse Supply Shocks and the Phillips Curve • Stagflation • Adverse Aggregate Supply Shocks • OPEC Oil Price Shock • Stagflation’s Demise
Adverse AS Shocks • Supported by Phillips data points from 1970s and 1980s • Series of adverse AS shocks occurred • AS shock –sudden, large increases in resource costs that jolt an economy’s SRAS curve leftward
The Long-Run Phillips Curve • No apparent long-run tradeoff b/w inflation and unemployment • Short-Run Phillips Curve – when actual rate of inflation is higher than expected, profits temporarily rise and unemployment temporarily falls • Long-Run vertical Phillips Curve – shows long run relationship b/w inflation and unemployment
Disinflation • Reductions in the inflation rate from year to year • Explained by Phillips Curve • Short run Phillips Curve shifts leftward
O 15.2 The Inflation-Unemployment Relationship • Long-Run Phillips Curve • Short-Run Phillips Curve • Long-Run Vertical Phillips Curve • Disinflation
15 12 9 6 3 3 4 5 6 The Inflation-Unemployment Relationship The Long-Run Vertical Phillips Curve PCLR PC3 b3 PC2 a3 b2 Annual Rate of Inflation (Percent) PC1 a2 c3 b1 a1 c2 0 Unemployment Rate (Percent)
Taxation and AS • Taxation is a key aspect of supply side economics – stresses that changes in AS are an active force in determining inflation, unemployment, and growth • Believe that high tax rates impede productivity and growth; discourage working, saving, and investing
Taxes and Incentive to Work • How long and hard people work depends on the amounts of after tax earnings they derive • Lower marginal tax rates encourage people to work harder
Incentives to Save and Invest • High marginal tax rates reduce rewards for saving and investing, and vice versa • Workers better equipped and productivity rises
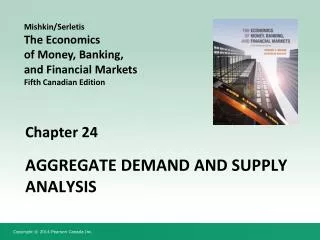
The Laffer Curve • Named after Arthur Laffer • Shows how reductions in marginal tax rates can increase the nation’s AS and leave tax revenues unchanged or enlarge them • See Figure 15.10 • Reasoning: lower taxes stimulate incentives to work and invest, output and income increase
Taxation and Aggregate Supply • Supply-Side Economics • Tax Incentives to Work • Tax Incentives to Save and Invest • The Laffer Curve 100 n Laffer Curve Tax Rate (Percent) m m Maximum Tax Revenue l 0 Tax Revenue (Dollars)
Taxation and Aggregate Supply • Criticisms of The Laffer Curve • Taxes, Incentives, and Time • Inflation and Higher Real Interest Rates • Position on the Curve • Rebuttal and Evaluation
Criticisms of the Laffer Curve • Taxes, Incentives, and Time: • Criticism relating to the degree to which economic incentives are sensitive to changes in tax rates • Decreases in taxes do not always encourage people to work more, some “buy more leisure”
Inflation or Higher Real Interest Rates • Tax cuts could also increase AD, leading to inflation or higher interest rates • Position on the Curve: there must be some level of tax rates between 0 and 100% at which tax revenues will be at their max
Rebuttal and Evaluation • Implemented successfully during Reagan admin in 1980s • Worked as Laffer Curve predicted • Although effects are often modest, they are considered in designing tax policy
Tax Cuts for Whom? Last Word A Supply-Side Anecdote • 10 People Have Breakfast Together for $100 • Charges are Divided in the Way Americans Pay Taxes • 4 Poorest Pay Nothing, Fifth Pays $1, Sixth Pays $3, Seventh Pays $7, Eighth Pays $12, Ninth Pays $18, Tenth the Richest Pays $59 • Works Fine Until Price is Cut by $20 – How to Divide the Cut?
Tax Cuts for Whom? Last Word A Supply-Side Anecdote • $20 Divided by 6 = $3.33 Resulting in Fifth and Sixth Being Paid to Eat Breakfast • Cook Suggests Dividing Proportionate to Price Paid by Each • Results in First 5 Paying Nothing, Sixth $2, Seventh $5, Eighth $9, Ninth $12, and Tenth Pays $52 • Each of the Paying 6 are Better Off Than Before
Tax Cuts for Whom? Last Word A Supply-Side Anecdote • Conflict Erupts Over Who Got How Much Relief – The Majority Going to the Richest • When Confronted the Richest Diner Didn’t Come the Next Day. • Surprise – They were $52 Short Without the Richest Payer
Tax Cuts for Whom? Last Word A Supply-Side Anecdote • Morals: People Who Pay the Most Taxes Reap the Most Benefit From Tax Cuts • Redistributing Tax Reductions at the Expense of those Paying the Highest Taxes May Produce Unintended Consequences!
short run long run Phillips Curve stagflation aggregate supply shocks long-run vertical Phillips Curve disinflation supply-side economics Laffer Curve Key Terms
Next Chapter Preview… Economic Growth Chapter 16!