Download
1 / 19
190 likes | 236 Vues
Learn about short and long-run aggregate supply concepts, effects of demand-pull inflation, cost-push factors, government dilemmas, recession impacts, the Phillips Curve theory, and the 1970s stagflation crisis. Explore taxation effects, the Laffer Curve, and Loanable Funds Theory.

E N D
Extending the Analysis of Aggregate Supply Chapter 16
Short Run Aggregate Supply • In macroeconomics this is the period in which wages (and other input prices) remain fixed as price level increases or decreases
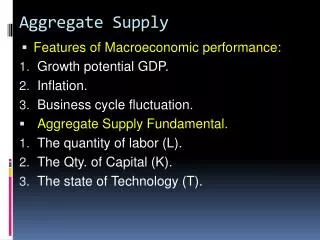
Long Run Aggregate Supply • Period of time in which wages have become fully responsive to changes in price level. Remember how crucial worker salaries to a businesses’ output and bottom line when considering effects on aggregate supply
Effects over Short-Run • In the short run, price level changes allow for companies to exceed normal outputs and hire more workers because profits are increasing while wages remain constant. • In the long run, wages will adjust to the price level and previous output levels will adjust accordingly
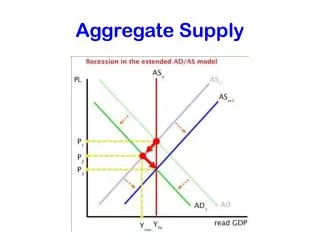
Equilibrium in the Extended Model • The extended model means the inclusion of both the short run and long run AS curves. • The Long AS Curve is represented with a vertical line @ full employment level of real GDP
Demand Pull Inflation in the AS Model • Demand-Pull – Prices increase based on increase in aggregate demand • In the short run, demand pull will drive up prices, and increase production • In the long run, increases in aggregate demand will eventually return to previous levels
Cost Push & the Extended Model • Cost-push arises from factors that will increase per unit costs such as increase in the price of a key resource • Short run shifts left. What is important is that in this case, it is the cause of the price level increase, not the effect.
Dilemma for the Government • In an effort to fight cost-push, the government can react in two different ways. • Action such as spending by the Gov’t could begin an inflationary spiral • No action however could lead to recession by keeping production and employment levels declining
Recession & the Extended Model • A recession is signaled on the model by a shift leftward of aggregate demand. Price level will decrease and eventually wages will fall as well. Output then return to the full employment level • How long this adjustment takes however is a matter of dispute among economists
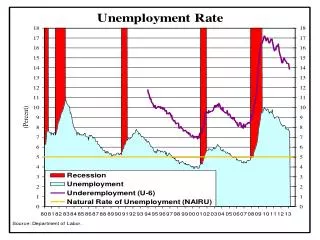
The Phillips Curve • Created by AW Phillips to examine relationship between inflation & unemployment • Basic premise is that inflation & unemployment have an inverse relationship • The 1970’s however put this theory into serious question due to stagflation – rising unemployment
Adverse Aggregate Supply Shocks of the 1970’s • What caused increases in both unemployment and inflation? • OPEC quadrupled their prices • Wages increased, however the dollar lost value, and productivity declined • Great stagflation of the “1970’s” made it clear that there was not always an inverse relationship between stable inflation & unemployment
Stagflation’s Demise • Stagflation – Stagnant economy mixed with high inflation • The recession ’81 & ’82 brought this to an end. • Tight money policies reduced double digit inflation however led to a higher unemployment rate and a lack of productivity. • Wages were also reduced both at home and abroad.
Stagflation Demise Cont’d • Deregulation of the Airlines as well as the trucking industries also resulted in wage & price reductions • OPEC lost a great deal of power which resulted in lower prices for oil.
Long-run Vertical Phillips Curve • View is that the economy is generally stable at the full-employment level. • Hypotheses question the existence of a long run relationship between unemployment and inflation • Fully anticipated inflation generates responsiveness by the work force and creates a vertical Phillips Curve.
Long-run Vertical Phillips Curve • View is that the economy is generally stable at the full-employment level. • Hypotheses questions the existence of a long run relationship between unemployment and inflation • Fully anticipated inflation generates and responsiveness by the work force creates a vertical Phillips Curve.
Interpretations of the Phillips Curve • Most economists acknowledge validity in the short-run (2-3 years). Long run tradeoff between inflation and unemployment is much less likely
Taxation & Aggregate Supply • Supply-side economics maintains that government policy reduces growth in a number of ways 1. Taxation negatively effects incentives to work 2. Taxation limits corporate investment 3. Government transfer programs discourage work
The Laffer Curve • Named after economist Arthur Laffer. It relates tax rates and tax revenues. • States that higher rates of taxation the government higher tax revenues. At some point, revenues will decline due to limitations on productivity. • Laffer argued that ultimately you can increase revenues by expanding output through lower taxes
Loanable Funds Theory • Supply slopes upward – more $$ available at higher interest rates. Most individuals need to be given incentive to save. • Demand slopes downward – rate of return on investment projects decreased by high rates. • The market is structured in a way that households invest their money with a specific financial institution. The institution then loans the money to businesses.