Aggregate Supply
Aggregate Supply. How the Aggregate supply curve illustrates the relationship between the aggregate price level and the quantity of aggregate output supplied in the economy. What factors can shift the aggregate supply curve.

Aggregate Supply
E N D
Presentation Transcript
Aggregate Supply How the Aggregate supply curve illustrates the relationship between the aggregate price level and the quantity of aggregate output supplied in the economy. What factors can shift the aggregate supply curve. Why the aggregate supply curve is different in the short run than in the long run.
Aggregate Supply • Economists model economy-wide consumption of goods and services with something called Aggregate Demand. • In the previous chapter, we saw that the AD curve is downward sloping • This shows that consumption of goods and services (real GDP) declines when the aggregate price level rises.
Aggregate Supply • The line parallel to AD is Aggregate Supply • Aggregate Supply shows us the relationship between economy-wide production and the Aggregate Price Level. • In the short run, there is a positive slope to the SRAS curve. • In the long run, the LRAS curve is vertical at the level of potential GDP.
The Short-Run Aggregate Supply Curve • Economists believe that in the short run, there is a positive relationship between the aggregate price level and quantity of aggregate output supplied, other things equal. • In other words, the SRAS curve is upward sloping like supply curves studied in microeconomics • Why??
The Short-Run Aggregate Supply Curve • What is the goal of the producers? • To earn a profit. • So each producer must ask the same basic question: is producing a unit of output profitable or not? • Profit per unit: Profit per unit of output = Price per unit of output – Production cost per unit of output.
The Short-Run Aggregate Supply Curve • Suppose that the price of a unit of output increased, but production cost of that unit stayed the same. • Profit on that unit will rise, and so it will be produced. • What if the price of output increased 5%, while the production cost increased 1%? • Profit on that unit will also rise, so it will be produced.
The Short-Run Aggregate Supply Curve • Summary: • If the price of a unit of output is rising faster than the cost of producing that unit of output, that unit of output will be produced. • This is exactly what economists believe happens in the short run. • This gives us an upward sloping curve
The Short-Run Aggregate Supply Curve • What explains this? • Some input prices are “sticky” – This just means that they don’t rise or fall very quickly in response to a change in demand for them. • Example: Labor • Wages are determined in the labor markets. Let’s consider what happens in both good and bad economic times
The Short-Run Aggregate Supply Curve • Scenario 1 (A strong economy) • Demand for products is strong and producers are selling their output like hotcakes, with rising output prices, and profit per unit of output is skyrocketing! • Eventually they need to hire more workers, and so the demand curve for labor shifts outward. • Yet employers are reluctant to immediately raise nominal wages and some employees have already agreed to be paid a lower wage so those wages are fixed for the time being. • Eventually the competition for good workers gets so fierce that nominal wages begin to rise.
The Short-Run Aggregate Supply Curve • Scenario 1 (A weak economy) • Demand for products is weak, the economy is in recession. • Producers are selling fewer units of output, with falling output prices, and profit per unit of output is crashing! • Eventually they need to reduce employment of workers, and so the demand curve for labor shifts inward. • Employers are somewhat reluctant to immediately lower nominal wages because they will lose employees. • Some employees have already signed contracts at a higher wage so those wages are fixed for the time being. • Eventually the labor market gets so weak, and unemployment is so high, that nominal wages begin to fall. • Bottom line, the price of output fell quickly with weaker demand, but the price of labor (nominal wage) fell much more slowly.
Shifts of the Short-Run AS Curve • The SRAS curve is upward sloping, but it can also shift to the right of left. • An increase, or outward shift, in SRAS means that producers are willing to produce more aggregate output at any price level. • A decrease in SRAS means that the SRAS curve shifts to the left. • A leftward shift implies that the quantity of Aggregate Output falls at any aggregate price level
Short Run AS Shifts • Changes in Commodity Prices • Changes in Nominal Wages • Change in Productivity
Change in Commodity Prices • A commodity is a standardized input bought and sold in bulk quantities. • Examples: oil, copper, steel • These commodities are production inputs for many final products so higher commodity prices make it more costly for firms economy-wide to produce. • This would shift SRAS to the left. • An economy-wide decrease in commodity prices would shift the SRAS curve to the right
Changes in Nominal Wages • A very important input to production is labor and the current price of labor is the nominal wage. • Gradually these nominal wages change due to changes in the labor markets. • In the Nominal Wage were to increase, the SRAS will shift to the left
Change in Productivity • Suppose workers at a factory are provided with better tools so that they can increase output with the same amount of effort. • If this is happening across the economy, the same amount of labor can produce more goods and services and SRAS shifts to the right
The Long-Run Aggregate Supply Curve • LRAS • The reason the SRAS was upward sloping was because nominal wages were sticky • (which means when the Aggregate Price Level rises, nominal wages rise more slowly) • So, what if they were not? • OR, what if there was enough time for all wages to adjust?
LRAS • If the price of output increased by 5% and nominal wages had enough time to increase by 5%, there would be no profit incentive to increase output. • All we would experience would be an increase in the Aggregate Price Level. • The LRAS is vertical • The LRAS touches the horizontal axis at the economy’s potential output, Yp: The level of real GDP the economy would produce if all prices, including nominal wages, were fully flexible.
LRAS • Many economists believe that, given enough time, the economy will adjust back to this level of output. • NOTE: The LRAS gradually shifts to the right over time. • Our economy’s potential output has increased due to better technology, and a larger and more educated workforce.
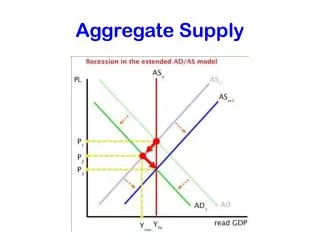
From the Short Run to the Long Run • The economy from year to year fluctuates around the level of potential output Yp. • Some years the economy is weak and real GDP lies below Yp. • Other years the economy is extremely strong and real GDP lies above Yp. • In the AD/AS model, the economy is always operating along the SRAS supply curve • But only sometimes does this coincide with the intersection of SRAS and LRAS. • This model predicts however, that, in the long run, the economy will adjust to where SRAS intersects LRAS at Yp • HOW?
Scenario 1 – The economy is weak and in a recession. In this scenario, current real GDP Y1 < Yp So what is expected to happen? A weak labor market has falling demand for labor. There are many unemployed workers. Employers find that they can get workers to accept lower wages. Eventually nominal wages fall and SRAS shifts to the right until current output is equal to Yp.
Scenario 2 – The economy is booming. In this scenario, current real GDP Y2 > Yp So what is expected to happen? A strong labor market has rising demand for labor. There are very few workers that are unemployed. Employers are scrambling to find scarce employees. Eventually nominal wages rise and SRAS shifts to the left until current output is equal to Yp.
Class Activity – Determine the effect on short-run AS of each of the following events. Explain whether it represents a movement along the SRAS curve (up of down) or a shift of the curve (left or right). • Respond to the following activities: 1. Hackers from a foreign country disable most corporate computing systems. This disruption continues off and on for several months 2. The price of grain, a key commodity, drastically increases as the nation switches to more biofuels as sources of energy 3. The First Lady’s goal of doubling the fraction of high school seniors that graduate from college is successful. 4. Due to a weak economy, the consumer price index falls for several consecutive months. 5.Labor unions are successful in organizing members throughout the economy and they negotiate higher wages and benefits.