Aggregate Supply
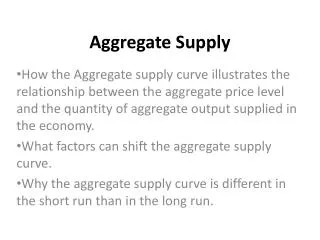
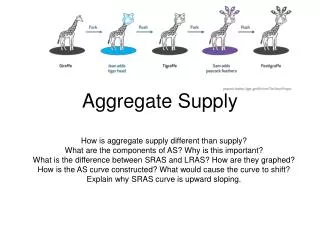
Aggregate Supply. Continued… . Describe the term aggregate supply. Explain, using a diagram, why the short-run aggregate supply curve (SRAS curve) is upward sloping.


Aggregate Supply
E N D
Presentation Transcript
Continued… • Describe the term aggregate supply. • Explain, using a diagram, why the short-run aggregate supply curve (SRAS curve) is upward sloping. • Explain, using a diagram, how the AS curve in the short run (SRAS) can shift due to factors including changes in resource prices, changes in business taxes and subsidies and supply shocks. • Explain, using a diagram,that the monetarist/new classical model of the long- run aggregate supply curve (LRAS) is vertical at the level of potential output (full employment output) because aggregate supply in the long run is independent of the price level. • Explain, using a diagram, that the Keynesian model of the aggregate supply curve has three sections because of “wage/price” downward inflexibility and different levels of spare capacity in the economy.
Continued… • Explain, using the two models above, how factors leadingto changes in the quantity and/or quality of factors • of production (including improvements in efficiency, new technology, reductionsin unemployment, and institutional changes) can shift the aggregate supply curve over the long term. • Equilibrium: • Explain, using a diagram, the determination of short-run equilibrium, using the SRAS curve. • Examine, using diagrams, the impacts of changes in short- run equilibrium.
Continued… • Explain, using a diagram, the determination of long-run equilibrium, indicating that long-run equilibrium occurs at the full employment level of output. • Explain why, in the monetarist/new classical approach, while there maybe short-term fluctuationsin output, the economy will always return to the full employment level of output in the long run. • Examine, using diagrams, the impacts of changes in the long-run equilibrium.
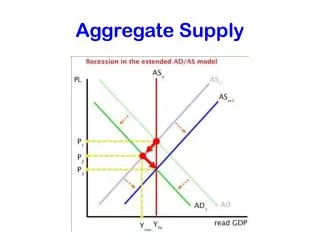
Continued… • Explain, using the Keynesian AD/AS diagram, that • the economy may be in equilibrium at any level of real output where AD intersects AS. • Explain, using a diagram, that if the economy is in equilibrium at a level ofreal output below the full employment level of output, then there is a deflationary (recessionary) gap. • Discuss why, in contrast to the monetarist/new classical model, the economy can remain stuck in a deflationary (recessionary) gap in the Keynesian model. • Explain, using a diagram, that if AD increases in the vertical section of the AS curve, then there is an inflationary gap. • Discuss why, in contrast to the monetarist/new classical model, increases in aggregate demand in the Keynesian AD/AS model need not • be inflationary, unless the economy is operating close to, or at, the level of full employment.
Continued… HL Only • Explain, with reference tothe concepts of leakages (withdrawals) and injections, the nature and importance of the Keynesian multiplier. • Calculate the multiplier using either of the following formulae. • 1/(1- MPC) • 1 /MPS + MPT + MPM • Use the multiplier to calculate the effect on GDP of a change in an injection in investment, government spending or exports. • Draw a Keynesian AD/AS diagram to show the impact of the multiplier.
Links to Theory of Knowledge • The Keynesian and Monetarist positions differ on the shape of the AS curve. What is needed to settle this question: empirical evidence (if so, what should be measured?), strength of theoretical argument, or factors external to economics such as political conviction?