
Quantifying measurement error
E N D
Presentation Transcript
Quantifying measurement error Blake Laing Southern Adventist University
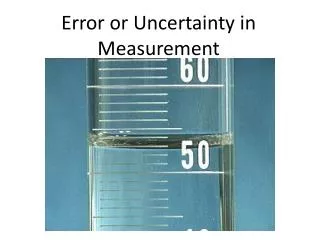
I uncertainty Measurements have no meaning without a quantified experimental error/uncertainty
Uncertainty • George: • What can he conclude? • Martha: • What can she conclude?
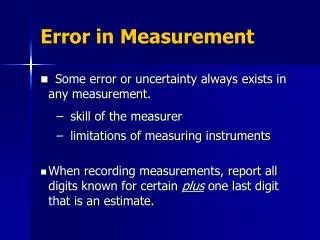
Uncertainty due to measurement error • A personal error is a mistake. • No need to quantify, but we should be able to recognize mistaken data • Two other measurement errors which are not accidental • Random error • Causes repeated measurements to be different • Causes wide “margin of error” • Systematic error • Repeated measurements are consistent • All measurements are shifted in a predictable way • Can be recognized and corrected by “shifting back”
Accuracy is not precision • Precision • “how close to each other” • Accuracy • “how close to expected” • Random error • Different error every time • Limits precision • Systematic error • Same error every time • Limits accuracy Precision Accuracy
Random error Quantified by statistics
Statistics in real life • Same breakfast: toast with almond butter • If weekly average > 120 mg/dL, must take insulin • Same breakfast: toast with almond butter • Different results
Random or systematic error? • Gaussian distribution, or “bell-curve” • 68% within some “distance” of mean • That “distance” is called the standard deviation • 68% within or • A 68% of past measurements were within • There was a 68% probability for each measurement to be within . • 68% confidence interval • I can say with 68% confidence that the next measurement will be within . • The precision of each measurement is quantified by • Systematic error: comparison to known • 68% probability that absolute error
Random error/precision in one measurement is quantified by • 68% confidence interval • I can say with 68% confidence that the next measurement will be within . • means that 68% of repeated measurements will be within onestandard deviation of the average • 95% confidence interval • 95% of previous measurements within . • I can say with 95% confidence that the next measurement will be within . • means that 95% of repeated measurements will be within twostandard deviation of the average • Good way to state precision of instrument
Precision of the mean quantified by α • Let’s take 100 measurements! • Will standard deviation decrease? • Shouldn’t we know mean value more precisely? • Precision of the mean, or “error of the mean” is quantified by the standard error. • 68% probability that the mean of a many more measurements would be within • If there were no systematic error… • the mean of many more measurements would be equal to the true value • There is a 68% probability that the true value is within • More common: 95% confidence int.
Measure with sanity • 68% CI for the next measurement • = • 95% CI for the next measurement
Measure with sanity • 68% CI for the next measurement • = • 95% CI for the next measurement • 68% CI for mean value • 95% CI for mean value
Systematic error Comparison to expectation
Systematic error: compare to “known” • Suppose that medical laboratory glucometer measures • (68% CI) Compare home device to this (68% CI) Absolute error:
Compared to what? Compare abs. err. to expectation Compare to random error in home device Is the absolute error large compared to the standard error? Then the mean for the home device has a significant systematic error. How many standard errors? May not need to be calibrated
Advice from previous students • “Take the time to get well acquainted with standard deviation and standard error on your first few labs... you'll be seeing them all year!” • “Learn how to quantify measurements in the beginning - believe me. • I didn't fully learn how to use the tools of the trade till the beginning of the second semester, and it would have paid to learn it first.” • “Know the significant figures for sure: locking in the understanding at the start of the semester saves you A LOT of points.”
Notes from the reader • Need precise, quantitative answers to questions • Less wordy “fluff”, more equations/numbers. • In every questions it is implied to use or refer to the appropriate “tool for the job”, such as percent error. • Need careful articulation of words to be able to have a carefully-articulated understanding. • Common mistakes on significant figures • use calculated standard error to determine correct sig figs on the mean • When calculating percent error, watch for the loss of sig figs when subtracting
Because I always back up my argument with an incisive quantitative analysis.
Quantifying measurement error necessary to form quantitative conclusions
Was that glucometer really so bad? • Expected value: 140 mg/dL • Mean value: about 267±1 mg/dL
A faulty assumption is a systematic error • Two hours after breakfast • Aqueous glucose vs whole blood • blood has a pH of about 7.4 (basic) • Distilled water has a pH < 7 (acidic) • Different density • Standard deviation about half of aqueous glucose solution • What is the 95% CI for each measurement? • What is the 95% CI for mean?
Reader notes • It appears that a number of people don’t have a solid grasp on what the 68% confidence intervals xav± σn m or xav±αn mean. • CI for each measurement: is a range of possible values of the measurement • About 68% of the measurements were within this range. • Implies that each measurement had a 68% probability of being within that range • Implies that it is exceedingly unlikely to be due to random error if one additional measurement is 10 away • CI for mean value • Implies that if there is no systematic error, there is a 68% probability that the true value is within this range • Less wordy, more equations/numbers. In every questions it is implied to use or refer to the appropriate “tool for the job”, such as percent error. • Statements like “Systematic error is 180” are concerning. • Need careful articulation of words to be able to have a carefully-articulated understanding. • Feel free to use pencil on everything but raw data
Question 1 • Does the standard deviation get much smaller as more measurements are taken? How about the standard error? Demonstrate by making a table of the standard deviation and standard error for 5, 25, and 50 data points using your data, and for all points of the class data. Would σ or α be more appropriate to describe the precision of an instrument?