Download
1 / 9
90 likes | 233 Vues
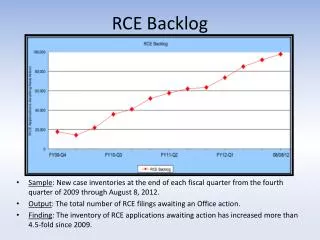
RCE Backlog. Sample : New case inventories at the end of each fiscal quarter from the fourth quarter of 2009 through August 8, 2012. Output : The total number of RCE filings awaiting an Office action.

E N D
RCE Backlog • Sample: New case inventories at the end of each fiscal quarter from the fourth quarter of 2009 through August 8, 2012. • Output: The total number of RCE filings awaiting an Office action. • Finding: The inventory of RCE applications awaiting action has increased more than 4.5-fold since 2009.
RCE Disposals Over Time • Sample: All application disposals for the indicated fiscal year. • Output: The fraction of total application disposals that were for entry of an RCE. • Finding: RCE disposals as a fraction of total application disposals has not increased over the period that has seen the increase in RCE inventory.
RCE Filings per Application • Sample: Applications with final disposals from June 2008 through May 2009 or June 2011 through May 2012. • Output: The fraction of applications in the entire sample containing the indicated number of RCE filings. • Finding: A substantial majority of disposals within the sampled time period did not include an RCE. The distribution has not significantly changed since fiscal year 2009.
RCE Frequency and Number of Claims • Sample: Allowance disposals from June 2011 through May 2012. • Output: Applications containing the indicated number of claims and at least one RCE as a fraction of the total number of applications containing the indicated number of claims. • Finding: Applications having more than 20 allowed claims are substantially more likely to include at least one RCE than applications having fewer than 20 claims.
RCE by Technology • Sample: Application final disposals from June 2011 through May 2012 • Output: The fraction of applications classified in the indicated technology disciplines containing the indicated number of RCE filings. • Finding: The fraction of applications containing RCE filings is generally the same across technology disciplines.
Condition of Application Prior to RCE Filing • Sample: RCEs filed Fiscal Year 2012 through September 20th. • Output: RCE filings as a function of the action that immediately preceded the RCE filing. • Finding: Two-thirds of RCEs filed were not prompted by action after final rejection.
Next Action Following After-final Amendment • Sample: Responses to after-final filed Fiscal Year 2012 through September 20th. • Output: First response to an after-final amendment. • Findings: Nearly one-third of after-final submissions resulted in allowance or reopening of prosecution.
RCE with no Submission After-Final Method: • The file history of a random sample of RCEs filed in fiscal year 2011 where no submission was filed under Rule 1.116 prior to the RCE filing was reviewed. Findings: • 27% of applications in which no response was filed after final were allowed in the first action after RCE. (Compare with 29% allowance rate after final.) • Assuming 25% of RCEs in this sample could have been allowed after final, more than 20,000 RCEs might have been avoided with after-final submissions.
Sampling of RCEs Filed After Allowance Method: • The file history of a random sample of applications having IDSs filed in fiscal year 2011 after allowance but prior to submission of the issue fee with or without an RCE was reviewed. Findings • 19% of RCEs filed after allowance included only an IDS and also included certification under 1.97(e). These submissions could have been made in the allowed application. • On average, a substantially larger number of references were cited in IDSs filed with an RCE (11 references) than without an RCE (3 references). • A substantially larger proportion of RCE filings (27%) included IDSs citing more than 20 references than without an RCE (4%).