Download
1 / 43
501 likes | 991 Vues
Chapter 6 An Introduction To Metabolism. Metabolism/Bioenergetics. Metabolism : The totality of an organism’s chemical processes; managing the material and energy resources of the cell Catabolic pathways : degradative process such as cellular respiration; releases energy

E N D
Metabolism/Bioenergetics • Metabolism: The totality of an organism’s chemical processes; managing the material and energy resources of the cell • Catabolic pathways: degradative process such as cellular respiration; releases energy • Anabolic pathways: building process such as protein synthesis; photosynthesis; consumes energy
Thermodynamics • Energy (E)~ capacity to do work; • Kinetic energy~ energy of motion; • Potential energy~ stored energy • Thermodynamics~ study of E transformations • 1st Law: conservation of energy; E transferred/transformed, not created/destroyed • 2nd Law: transformations increase entropy (disorder, randomness) • quantity of E is constant, quality is not
Free Energy • Free energy: portion of system’s E that can perform work (at a constant T) • Exergonic reaction: net release of free E to surroundings • Endergonic reaction: absorbs free E from surroundings
Free Energy Equation Organisms live at the expense of free energy. The amount of energy available to do work. G = H - TS G = free energy H = enthalpy or total energy T = temperature in 0K S = entropy (disorder/randomness)
Significance of Free Energy Indicates whether a reaction will occur spontaneously or not. In a spontaneous reaction, G decreases, DG<0 (negative) EXERGONIC REACTIONENDERGONIC REACTION Products have less G Products have more G Reaction is ‘downhill’ Reaction is ‘uphill’ Spontaneous Require energy input DG is negative DG is positive
Metabolic Disequilibrium Many metabolic reactions are reversible and reach equilibriuim. At equilibrium a cell is dead! Disequilibrium is maintained by the continual use/removal of products e.g. respiration
Energy Coupling & ATP • E coupling: use of exergonic process to drive an endergonic one (ATP) • Adenosine triphosphate • ATP tail: high negative charge • ATP hydrolysis: release of free E • Phosphorylation (phosphorylated intermediate)~ enzymes
Chemical Reactions Animation 6.1.1
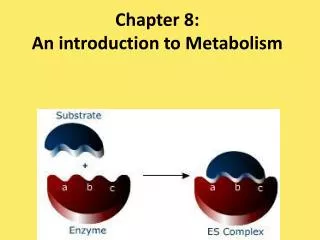
Enzymes • Catalytic proteins: change the rate of reactions w/o being consumed • Free E of activation (activation E): the E required to break bonds • Substrate: enzyme reactant • Active site: pocket or groove on enzyme that binds to substrate • Induced fit modelbinding of substrate changes shape of the active site so that the substrate can bind
Enzyme Properties • Are proteins • Lower the activation energy of a reaction – • transition state can be reached at cellular temperatures. • Do not change the nature of the reaction – • only speed up a reaction that would have occurred anyway. • Are very selective for which reaction they will catalyze • Substrate + enzyme • enzyme-substrate complex • product + enzyme
How an Enzyme Lowers Activation Energy • Active site holds 2 or more reactants. • Induced fit distorts bonds-less E required to break them. • Active site may produce a micro-environment. • Side chains of amino acids may participate.
How Enzymes Work Animation 6.1.6 http://www.chem.ufl.edu/~itl/2045/lectures/lec_m.html
Initial Substrate Conc. Determines Rate of an Enzyme-Controlled Reaction • The higher the substrate conc. the faster the reaction • If the substrate concentration is high enough – • the enzyme may become saturated, reaction will slow • Reaction rate may be increased by adding more enzyme.
Effects on Enzyme Activity • Temperature • pH • Cofactors: inorganic, nonprotein helpers; e.g. zinc, iron, copper • Coenzymes: organic helpers; e.g. vitamins
Enzyme Inhibitors • Irreversible (covalent); Reversible (weak bonds) • Competitive: competes for active site (reversible); mimics the substrate • Noncompetitive: bind to another part of enzyme (allosteric site) altering its conformation (shape); poisons, antibiotics
Allosteric Regulation Allosteric enzymes have two conformations, one catalytically active, the other inactive. Binding of an activator to the allosteric site stabilizes the active conformation of the enzyme Binding of an inhibitor to the allosteric site stabilizes the inactive form of the enzyme (non-competitive)
Cooperativity Binding at one site enhances binding at other sites
Each enzyme is specific for the reaction it will catalyze. In this laboratory,Enzyme = catalase Substrate = hydrogen peroxide (H2O2)Products = water and oxygen H2O2 H2O + O2 If a small amount of catalase is added to hydrogen peroxide, you will be able to observe bubbles of oxygen forming.
To determine the amount of hydrogen peroxide that remains after the reaction, you will do a titration with KMnO4. In such a titration, you slowly add a chemical (KMnO4) that will cause a color change until a target is achieved.
To determine how much hydrogen peroxide (substrate) has been broken down by catalase at varying times, you measure the amount of peroxide remaining in each flask.
Analysis of ResultsEnzyme Action Over Time We can calculate the rate of a reaction by measuring, over time, either the disappearance of substrate or the appearance of product. For example, on the graph above, what is the rate, in moles/second, over the interval from 0 to 10 seconds? Rate = Dx = 7-0 moles = 7 = 0.7 mols/sec Dy 10-0 seconds 10
Calculate the rate in moles/second between 40 and 50 seconds.
After 40 seconds there were no more substrate molecules. The curve becomes flat at this point, and the rate is zero.
During what time interval is the enzyme working at its maximum velocity? a. 0–30 seconds b. 60–120 seconds c. 120–180 seconds d. Over the entire time course
In order to keep the rate constant over the entire time course, which of the following should be done? • Add more enzyme. • Gradually increase the temperature after 60 seconds. • Add more substrate • Add H2SO4 after 60 seconds. • Remove the accumulating product.
Which of the following graphs represents the rate of the reaction shown above? Notice that in the graphs below, the y-axis is number of molecules/sec.
What is the role of sulfuric acid (H2SO4) in this experiment? a. It is the substrate on which catalase acts b. It binds with the remaining hydrogen peroxide during titration c. It accelerates the reaction between enzyme and substrate d. It blocks the active site of the enzyme e. It denatures the enzyme by altering the active site
A student was performing a titration for this laboratory, and accidentally exceeded the endpoint. What would be the best step to obtain good data for this point? a. Estimate the amount of KMnO4 that was in excess, and subtract this from the result b. Repeat the titration using the reserved remaining sample. c. Obtain data for this point from another lab group d. Prepare a graph of the data without this point, and then read the estimated value from the graph.