Population Genetics
Population Genetics. Population Genetics. The study of genetic variation in populations. Population. A localized group of individuals of the same species . Species. A group of similar organisms. A group of populations that could interbreed. Gene Pool.

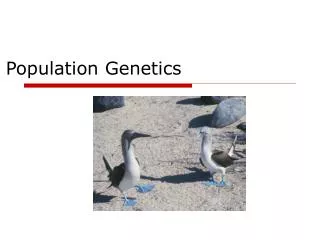
Population Genetics
E N D
Presentation Transcript
Population Genetics • The study of genetic variation in populations.
Population • A localized group of individuals of the same species.
Species • A group of similar organisms. • A group of populations that could interbreed.
Gene Pool • The total aggregate of genes in a population. • If evolution is occurring, then changes must occur in the gene pool of the population over time.
Microevolution • Changes in the relative frequencies of alleles in the gene pool.
Hardy-Weinberg Theorem • Developed in 1908. • Mathematical model of gene pool changes over time.
Basic Equation • p + q = 1 • p = % dominant allele • q = % recessive allele
Expanded Equation • p + q = 1 • (p + q)2 = (1)2 • p2 + 2pq + q2 = 1
Genotypes • p2 = Homozygous Dominants2pq = Heterozygousq2 = Homozygous Recessives
Example Calculation • Let’s look at a population where: • A = red flowers • a = white flowers
Starting Population • N = 500 • Red = 480 (320 AA+ 160 Aa) • White = 20 • Total Genes = 2 x 500 = 1000
Dominant Allele • A = (320 x 2) + (160 x 1) = 800 = 800/1000 A = 80%
Recessive Allele • a = (160 x 1) + (20 x 2) = 200/1000 = .20 a = 20%
A and a in HW equation • Cross: Aa X Aa • Result = AA + 2Aa + aa • Remember: A = p, a = q
Substitute the values for A and a • p2 + 2pq + q2 = 1 (.8)2 + 2(.8)(.2) + (.2)2 = 1 .64 + .32 + .04 = 1
Dominant Allele • A = p2 + pq = .64 + .16 = .80 = 80%
Recessive Allele • a = pq + q2 = .16 + .04 = .20 = 20%
Result • Gene pool is in a state of equilibrium and has not changed because of sexual reproduction. • No Evolution has occurred.
Importance of Hardy-Weinberg • Yardstick to measure rates of evolution. • Predicts that gene frequencies should NOT change over time as long as the HW assumptions hold. • Way to calculate gene frequencies through time.
Example • What is the frequency of the PKU allele? • PKU is expressed only if the individual is homozygous recessive (aa).
PKU Frequency • PKU is found at the rate of 1/10,000 births. • PKU = aa = q2 q2 = .0001 q = .01
Dominant Allele • p + q = 1 p = 1- q p = 1- .01 p = .99
Expanded Equation • p2 + 2pq + q2 = 1 (.99)2 + 2(.99x.01) + (.01)2 = 1 .9801 + .0198 + .0001 = 1
Final Results • Normals (AA) = 98.01% • Carriers (Aa) = 1.98% • PKU (aa) = .01%
AP Problems Using Hardy-Weinberg • Solve for q2 (% of total). • Solve for q (equation). • Solve for p (1- q). • H-W is always on the national AP Bio exam (but no calculators are allowed).
Hardy-Weinberg Assumptions 1. Large Population 2. Isolation 3. No Net Mutations 4. Random Mating 5. No Natural Selection
If H-W assumptions hold true: • The gene frequencies will not change over time. • Evolution will not occur. • But, how likely will natural populations hold to the H-W assumptions?
Microevolution • Caused by violations of the 5 H-W assumptions.
Causes of Microevolution 1. Genetic Drift 2. Gene Flow 3. Mutations 4. Nonrandom Mating 5. Natural Selection
Genetic Drift • Changes in the gene pool of a small population by chance. • Types: • 1. Bottleneck Effect • 2. Founder's Effect
Bottleneck Effect • Loss of most of the population by disasters. • Surviving population may have a different gene pool than the original population.
Result • Some alleles lost. • Other alleles are over-represented. • Genetic variation usually lost.
Importance • Reduction of population size may reduce gene pool for evolution to work with. • Ex: Cheetahs
Founder's Effect • Genetic drift in a new colony that separates from a parent population. • Ex: Old-Order Amish
Result • Genetic variation reduced. • Some alleles increase in frequency while others are lost (as compared to the parent population).
Importance • Very common in islands and other groups that don't interbreed.
Gene Flow • Movement of genes in/out of a population. • Ex: • Immigration • Emigration
Result • Changes in gene frequencies.
Mutations • Inherited changes in a gene.
Result • May change gene frequencies (small population). • Source of new alleles for selection. • Often lost by genetic drift.
Nonrandom Mating • Failure to choose mates at random from the population.
Causes • Inbreeding within the same “neighborhood”. • Assortative mating (like with like).
Result • Increases the number of homozygous loci. • Does not in itself alter the overall gene frequencies in the population.
Natural Selection • Differential success in survival and reproduction. • Result - Shifts in gene frequencies.
Comment • As the Environment changes, so does Natural Selection and Gene Frequencies.
Result • If the environment is "patchy", the population may have many different local populations.