Download
1 / 70
700 likes | 920 Vues
Life Cycle Analysis. Cradle to Grave Impacts. What Can the Earth Handle?. World Population Statistics UN Population Division. The estimate of Earth’s Maximum supportable population is 13.4 billion. Looking at the population statistics, where are we headed?

E N D
Life Cycle Analysis Cradle to Grave Impacts
What Can the Earth Handle? World Population Statistics UN Population Division • The estimate of Earth’s Maximum supportable population is 13.4 billion. • Looking at the population statistics, where are we headed? • Renewable Energy Source Will Limit Our Growth! • Average per capita energy consumption is 3 kW/person • US 12 kW/person • Industrialized 7.5 kW/person • Denmark 5.1 kW/person • Developing 1kW/person
Being Green is Trendy . . . . . . . What Does Science Say? • Industry is looking for ways to green their products and manufacturing processes. • Individuals and families are looking to green their homes and lifestyles. • How can you tell if something really is green?? • What is currently happening to achieve this goal? • Scientists perform a Life Cycle Assessment (LCA)
What is LCA? Steps and Methodology
Cradle to Grave Cradle to Shelf Comprehensive Evaluation of Impact
LCA helps to avoid shifting environmental problems from one area or medium to another.
Who Does LCA? • Conducted by an industry sector to enable it to identify areas where improvements can be made, in environmental terms. • LCA may be intended to provide environmental data for the public or for government. • Companies use LCA for marketing and advertising, to support claims that their products are 'environmentally friendly' or even 'environmentally superior' to those of their rivals.
A life-cycle approach • Ensures companies identify the multiple environmental and resource issues across the entire life-cycle of the product • Knowledge of these issues informs business activities: • planning, procurement, design, marketing & sales • Rather than just looking at the amount of waste that ends up in a landfill or an incinerator, a life-cycle approach identifies energy use, material inputs and waste generated from the time raw materials are obtained to the final disposal of the product * * Product Life-Cycle Analysis: Environmental activities for the classroom, Waste Management and Research Center, Champaign, IL, 1999
Water Land Transport
A life-cycle approach • With a life-cycle approach, companies employ the tools they need to: • Reduce impacts across the life-cycle • Capitalize on opportunities for their business • How about Hussey Seating Company? • Reduced packaging requirements? • Thinner, lighter water bottles? • Other examples? • Tools range from simple mapping of life-cycle stages to comprehensive quantitative assessments
Life-cycle assessment • Two attributes make LCA distinct and useful as an analytical tool: • Whole system consideration of the total product life-cycle • Presentation of tradeoffs among multiple environmental issues • LCA is quantitative (within limits)
LCA Method(s) • Initially, numerous variants of LCA “methods” were developed/investigated, but today there is consensus that there is only one basic method with a large number of variants • Originally called REPAs – Resource and Environmental Profile Analysis • The Society of Environmental Toxicology and Chemistry (SETAC), an international platform for toxicologists, published a Code of Practice, a widely accepted series of guidelines and definitions. • IS0 14040-14043 is considered to be the LCA standard. • EPA/600/R-06/060, May 2006, Life Cycle Assessment: Principals and Practice
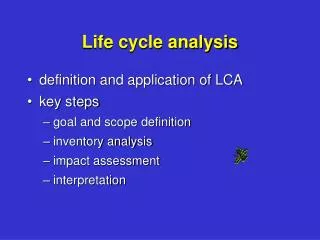
The Four Steps of an LCA • Goal and Scope Definition (ISO 14040) • The Life-Cycle Inventory (ISO 14041)- What are the energy, raw materials, emissions, & wastes? What data are needed? • Life-Cycle Impact Analysis (ISO 14042)- Assess environmental impacts identified in the life-cycle inventory. • Life-Cycle Improvement - (ISO 14043)Identifies opportunities to reduce the environmental impacts by modifying of the life-cycle inventory. • ISO1400 link provided for reference only.
Raw Materials Materials Processing Water Effluents Air Emissions Solid Wastes Other Releases Usable Products Materials Energy Transport Product Manufacture Retail Outlets Product Use and Service Reuse - Recycling Disposal Areas covered by LCA
How to do LCA • Determine scope and system boundaries • functional unit • life-cycle stages • define “unit processes” • Life Cycle Inventory aka Data collection • Analysis of inputs and outputs • Assessment of numerous environmental issues • Interpretation • Life Cycle Improvement
Function & Functional Unit Function Example Wooden Pencil vs. Mechanical Pencil Function = “Writing” Functional Unit = “1 meter of writing” • Service provided by a system • What it does! • Functional Unit • Gives the function a number value • Allows comparison between products • Reference point
Function and Functional Unit • Where to draw the line? • HUGE impact on results • Compare one reusable bag to one single-use plastic bag? How many uses? • What are some reasonable assumptions? • Reading assignment used # of bags required to carry 70 items home each week for one year.
Life-cycle stages • Products can be evaluated through each stage of their life-cycle: • Extraction or acquisition of raw materials • Manufacturing and processing • Distribution and transportation • Use and reuse • Recycling • Disposal • For each stage, identify inputs of materials and energy received; outputs of useful product and waste emissions • Find optimal points for improvement – eco-efficiency
Single Stage Flow Diagram • The following diagram contains inputs and outputs to be quantified in a single stage or unit operation • Source: EPA Life-Cycle Design Guidance Manual, EPA Report no. EPA/600/R-92/226, page 104
Product Life Cycle M, E M, E M, E M, E M, E M, E M a t e r i a l M a n u f a c t u r e U s e & R e t i r e m e n t T r e a t m e n t R a w M a t e r i a l P r o c e s s i n g & A s s e m b l y S e r v i c e & R e c o v e r y D i s p o s a l A c q u i s i t i o n W W W W W W r e u s e r e m a n u f a c t u r e o p e n - l o o p c l o s e d - l o o p r e c y c l e r e c y c l e M, E = Material and Energy inputs to process and distribution W = Waste (gas, liquid, or solid) output from product, process, or distribution Material flow of product component
Time-sensitive: past 5 years Geographical: does it match the location from the goal Technology: best available technology for process Representativeness: reflects population of interest Consistency: matches the procedure Reproducibility: another person could find it Never Forget . . . . . . . Accuracy: Quantified values are correct Precision: The consistent reproducibility of a measurement Completeness: Covers all the areas outlined in the scope Data CollectionLife Cycle Inventory Analysis
Items To Consider?? Inputs Outputs What comes out of the system! Products (electricity, materials, goods, services) Waste Emissions Co-products • What is needed to make the substance • Energy • Water • Materials • Land • Labor
Problems with Inventory Analysis • The inventory phase usually takes a great deal of time and effort and mistakes are easily made. • There exists published data on impacts of different materials such as plastics, aluminum, steel, paper, etc. • However, the data is often inconsistent and not directly applicable due to different goals and scope. • It is expected that both the quantity and quality of data will improve in the future. • Mass and energy balances are not correct and defy laws of thermodynamics. • Results are generalized improperly.
Global Warming Potential Gases in the atmosphere that absorb and emit radiation Trap heat from the sun Water vapor, CO2 , CH4 , ozone, NO2 Abiotic Depletion Consumption of non-living resources Human Toxicity Potential Value that shows harms to humans from chemicals Land Use How much land is needed Data AnalysisEnvironmental Impact Categories
Eutrophication Increase in chemical nutrients containing nitrogen or phosphorus land or water overgrowth of plants killing organisms at bottom of water Water Use Mercury Acidification caused by pollution from fuels & acid rain low pH Smog (Winter or Summer) Energy Use Solid Waste Oil . . . . . . . AND MANY MORE!! Environmental Impact Categories Continued . . . . .
Resource depletion Green house effect Depletion of ozone layer Global Impact Categories • Source: Use of copper, zinc, oil etc. • Effect: Reduction of possibilities for future generations • Source: Combustion (transport, energy etc.) • Effect: Increase in temperature, desert formation etc. • Source: CFC and HCFC from foam and coolants • Effect: UV radiation, skin cancer etc.
Ozone formation Acidification Eutrofication Persistent toxicity Regional Impact Categories • Source: Transport, energy, industry (Hydrocarbons etc.) • Effect: Ozone formation (Damage of lung tissue etc. ) • Source: Transport, energy,agriculture • Effect: Damage to woodlands, lakes and buildings (SOx, NOx, NH3 ) • Source: Fertilisers, waste water, transport and energy • Effect: Eutrophication (Damage to plants and fish) • Source: Waste water, incineration, industry, ships etc. • Effect: Accumulation:Chronic damage to ecosystems and organisms
Why Conduct an LCA? Benefits and Drawbacks
LCA and the Regulatory Process • LCA is voluntary in the U.S. at present • Its use is limited, but expanding • LCA is mandatory in some European countries • Used as the basis of packaging recovery and recycling targets • Global market means LCA will eventually be required for all products
Life-cycle – helps avoid shifting the issues • Looking at the entire life-cycle helps ensure reducing waste at one point does not simply create more waste at another point in the life-cycle • Issues may be shifted – intentionally or inadvertently – among: • Processes or manufacturing sites • Geographic locale • Different budgets and planning cycles (first cost) • Environmental media – air, water, soil (MTBE) • Sustainability dimension: economic, social, environmental burdens • Depends on “boundaries” • Be conscious of what is shifted and to where! • For example, MTBE…
Methyl tertiary butyl ether - MTBE Replaced lead in gasoline. Good!
But, MTBE itself is toxic if not fully combusted • MTBEmeasured in the environment (evaporated from gasoline or leaking from storage tanks, lines and fueling stations) • MTBE in potable water supplies is of most concern (lakes, reservoirs, and groundwater) • MTBE concentrations in some cases already exceed standard indicators for potable water, including "taste and odor" and "human health". • Insufficient amount of information on its long-term toxicity, carcinogenicity and reproductive toxicity, to humans, animals and ecosystems
Life-cycle – identify issues and costs $ $ Disposal & Post-Disposal Use Acquisition Acquisition Refrigerator A Refrigerator B Refrigerator A Refrigerator B Purchase Price Refrigerator A appears cheaper Price + Life-Cycle Costs Refrigerator B costs less overall
Benefits Of LCA • Companies can claim one product is better than another on the basis of LCA • LCA inventory process helps to narrow in on the area where the biggest reductions in environmental emissions can be made • Can be used to reduce production costs
Drawbacks of LCA • Using LCA to compare products is like comparing apples to oranges. • For example, which is worse: a product that pollutes the air by consuming energy from coal-fired power plants or one that disrupts ecosystems by consuming energy from massive hydroelectric dam projects? Both types of pollution should be minimized if possible.
Drawbacks (cont.) • Comparison between heavy energy demand and heavy water use: which imposes greater environmental burden? • How can the use of non-renewable mineral resources like oil or gas (the ingredients of plastics) be compared with the production of softwoods for paper? • How should the combined impacts of the landfilling of wastes (air and groundwater pollution, transport impacts etc) be compared with those produced by the burning of wastes for energy production (predominantly emissions to air)?
Drawbacks (cont.) • LCAs may give different and sometimes contradictory conclusions about similar products. • Recycling adds more complexity to LCA.
Conclusions – why take a life-cycle approach? • Systems perspective • Integrates environment into core business issues • Efficiency • Innovation • Better return on investment – identify point of “biggest bang for the buck” * • Engage stakeholders – investors, customers, employees * www.ciwmb.ca.gov/EPP/LifeCycle/default.htm
Did you know… • Producing one ton of recycled steel saves the energy equivalent of 3.6 barrels of oil and 1.5 tons of iron ore, compared to the production of new steel? • Producing paper using a chlorine-free process uses between 20 and 25 percent less water than conventional chlorine-based paper production processes?
Goal and ScopeWooden Pencil vs. Mechanical Pencil Goal = Compare 2 writing utensils for classroom use. Scope: Wooden Pencil (T = Transportation) Process Flow Diagram T T T T T T Rubber (Landfill) Sharpening T Graphite T (Electricity) Packaging T Brass
Scope: Mechanical Pencil PE = Polyethylene PP = Polypropylene Both materials are plastic polymers (large molecules) used to make many products. www.germes-online.com T T T T T T Rubber (Landfill) T Graphite T Packaging T T = Transportation Spring
Example: Simplified Process Tree for a Coffee Machine’s Life-Cycle
Worldwatch Institute, Worldwatch Paper 166: Purchasing Power: Harnessing Institutional Procurement for People and the Planet, July 2003, www.worldwatch.org
Pesticides Finishing chemicals Worldwatch Institute, Worldwatch Paper 166: Purchasing Power: Harnessing Institutional Procurement for People and the Planet, July 2003, www.worldwatch.org
Identifying issues at each life-cycle stage Estimated amount of synthetic fertilizers and pesticides it takes to produce the cotton for a conventional pair of jeans. Source: “The Organic Cotton Site: Ten good reasons”