Colorado Growth Model Overview: Key Findings and Remediation Insights
270 likes | 405 Vues
This presentation by Dr. Jed Bowman, dated March 3, 2009, outlines the Colorado Growth Model (CGM) and its implications for education. It details CGM's methodology for assessing student growth based on peer comparisons rather than mere achievement. The report also highlights findings from the CCHE Remediation Report, indicating that 30% of students needed remediation. The analysis compares growth metrics between the CGM and the DCSD model and emphasizes the importance of readiness for college and career through effective instructional strategies.

Colorado Growth Model Overview: Key Findings and Remediation Insights
E N D
Presentation Transcript
Colorado Growth Model Jed Bowman, Ph.D. March 3, 2009
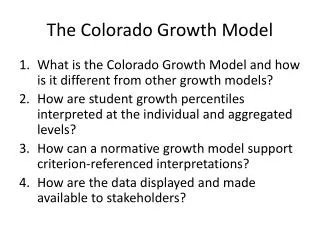
Agenda • Colorado Growth Model (CGM) • DCSD Results • CCHE Remediation Report
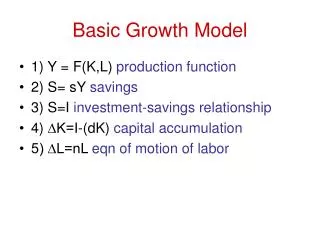
CGM—Background • HB 07-1048:Longitudinal Analysis of Student Assessments (Feb. 2007) • Continued work started in 2004 (HB 04-1433) • Technical Advisory Panel developed the growth model • State Board adopted growth model March 6, 2008 • School awards based on the growth model
CGM—Student Level Academic Peers A child’s progress is being compared with students who had similar academic results on state tests in previous years.
CGM—Student Level Growth Percentile: A child’s growth is measured by how fast they progressed compared with their academic peers. If a student has a growth percentile of 55, they made better progress than 55 percent of their academic peers.
CGM—Student Level Growth Percentiles are a measure of growth…… NOT a measure of achievement
CGM—Student Level Typical growth is represented by the percentile range Typical = 35th to 65th percentile High = above 65th Low = below 35th percentile
CGM—Student Level Adequate growth is the growth necessary to achieve proficiency within three years or by the 10th grade.
CGM VS DCSD Model • DCSD Growth Model • Uses CSAP Scale Score • Criterion Referenced • Static Measure • Colorado Growth Model • Norm Referenced • Performance of Academic Peers • Dynamic Measure
CGM—School Level Median student growth percentile is the growth measure for schools.
CGM—Why the Median? 18 15 8 8 7 7 6 7 5 Mean = 9 Median = 7
CGM—School/District Level District/School Ranking Academic Achievement AND Growth
CCHE Remediation Report Jed Bowman, Ph.D. March 3, 2009
CCHE Remedial PolicyC.R.S. 23-1-113.3 • Purposes • 1st time students are prepared to succeed • Students needing remedial instruction are provided accurate information • Public high schools are informed on college readiness
CCHE Remediation Report • Required annually • Report URL (http://highered.colorado.gov) • Data Requirements • State-supported institutions 2-yr and 4-yr • 1st time degree or non-degree seeker • Age 16-19 • Previous year HS graduate
Remediation Report—State Results • 30% needed remediation in at least 1 discipline (N = 28,162) • 2-year schools—53% • 4-year schools—21% • Mathematics has highest rate • 61% passing rate • 52% retention rate • 64% retention rate (Non remedial students)
Remediation Report—Indicators N = 3524 N = 3524
Remediation Report—Results N = 1434
District Actions • ACT Focus Group • Course Sequence • Essential Learnings • College Readiness Standards • ACT-Snap • Predictive Assessments (Explore, PLAN) • College and Workforce Readiness • Student Learning Goals